- Home
- About the Journal
- Peer Review
- Editorial Board
- For Authors
- Reviewer Recognition
- Archive
- Contact
- Impressum
- EWG e.V.
The global issue of diabetes mellitus (DM), which is a serious burden faced by the healthcare systems and economies in many countries, has been increasing steadily in the recent decades. The fast pace of DM growth and prevalence, as well as associated complications (macro- and microangiopathy, neuropathy, nephropathy, impaired vision), high economic costs and social damage, high disability and mortality rates entailed by this disease take constant improvement of the respective diagnostics, prevention and treatment approaches.
Dental manifestations of DM are diagnosed in most patients and reveal themselves through demineralized hard dental tissues, high intensity of dental caries and its prevalence, as well as the prevalence of periodontal diseases and issues affecting the oral mucosa. Our research included 60 male Wistar stock rats, all divided into two groups: the comparison group with no DM (n=10) and the main group with induced DM (n=50). DM modeling was done by a single intraperitoneal injection of streptozotocin (dosage – 65 mg/kg). The main group lab animals were removed from the experiment on Days 8, 16, 24, 32 and 60 under anesthesia by decapitation. All the histological and morphometric changes observed in the dental tissues were recorded in the ImadgeJ software package using a Leica DM2500 hardware and software set.
The studied sections were used to evaluate the thickness of enamel, dentin, predentin, cement, pulp, the dentin tubule diameter, as well as the density of odontoblasts and ameloblasts. On Day 60 into the experiment, the following changes were identified in relation to the hard dental tissues: regarding the enamel − demineralization, disintegration of the interprism substance; deformed enamel prisms; erosion-type defects developing; regarding the dentin − expanded dentin tubules, vacuole dystrophy of odontoblasts, accumulating edematous fluid under the odontoblast layer, deformation and atrophy of odontoblasts; regarding the cement – layer thinning, cementolysis, cavities developing. Quantitative evaluation of rat dental tissues on Day 60, if compared with intact animals, revealed a multidirectional dynamics in the morphometric values.
There was a statistically significant (p≤0.05) decrease in the enamel thickness identified (from 31.06±2.17 microns to 18.19±1.36 microns), in predentin (from 25.19±1.48 microns to 20.93±1.16 microns), in cement (from 37.28±2.04 microns to 31.04±1.46 microns), in the dentin tubule diameter (from 1.82±0.14 microns to 1.56±0.13 microns), as well as in the density of odontoblasts (from 7683.24±319.76 units/mm2 to 7312.61±256.19 units/mm2) along with a statistically reliable (p ≤0.05) increase in the thickness of dentin (from 96.54±3.39 microns to 105.11± 3.16 microns), pulp (from 107.43± 4.12 microns to 120.38±5.26 microns), as well as in the ameloblast density (from 6471.39± 272.18 units/mm2 to 6849.06±253.84 units/mm2). The outcomes expand the understanding of the structural changes affecting rat dental tissues at various times through modeling of Type 1 diabetes, as well as results could be used for developing pharmacological correction methods aiming at the reduction of the pathology intensity.
Keywords: Type 1 diabetes mellitus; experimental diabetes; streptozotocin; histological studies; morphometric studies; laboratory animals; rats; dental tissues.
As reported by the International Diabetes Federation (IDF), 537 million patients with diabetes mellitus (DM) were registered in 2021 globally, and this figure accounts for 6% of the whole globe’s population, with ⅔ of all patients with DM being in their capable and working age. The prevalence of DM has been growing continuously over the past decades and, the IDF epidemiological forecasts hold it that by 2030 the growth rate will be 1.5 times (552 million people), reaching 7-8% of the total world population [1].
Type 1 diabetes accounts for around 10% of all diabetes cases. DM results from the death of pancreatic β-cells, which, in turn, stops the production of insulin – the key regulator of carbohydrate and lipid metabolism in the body. The medical and social significance of the Type 1 diabetes problem in childhood is due to the fact that it involves into the pathology basically all organs and systems. Besides, the nature of the endocrinopathy is latent, whereas clinical symptoms manifest only when the pancreas functional capabilities are completely depleted; other significant related issues include early development of chronic (diabetic micro- and macroangiopathies) and acute (diabetic comas) specific complications, impaired sexual and physical development followed with partial loss of working capacity and early disability, reduced quality and life expectancy, premature mortality, as well as significant economic damage suffered by both the state and society [2-6].
The overall level of progress, the tasks faced and the opportunities available within dentistry have increased and grown to become more complicated in recent decades. The wide scope and a better level of the dental care, coupled with further development and introduction of advanced diagnostic methods for dental patients, have set new tasks on conducting in-depth studies and applying modern morphological methods [7-19].
The level of dental health in case of Type 1 diabetes, determined by the resistance of hard dental tissues and periodontium, the stability of the physical and chemical properties of the oral fluid, the protective function of the oral mucosa, as well as the local immunity status, offer an objective reflection of the intensity of neuroregulatory, metabolic, immunological, homeostatic and hemodynamic disorders affecting the host [20-23]. There is evidence-based proof available to a close interconnection between the insulin apparatus dysfunction and the intensity of lesions in body organs and the oral cavity. Moreover, the severity of manifestations in Type 1 diabetes varies from complete compensation to the most severe disorders [24-28].
Improving histological and histomorphometric approaches and techniques allow expanding the potential of experimental study focusing on hard dental tissues, despite the issues related to their morphological and crystal chemical structure, the small size of the elements, high mineralization and complexity of the structure [29-33]. There is a need for joint efforts taken by specialists involved in various fields of medical knowledge, both clinical and morphological, in order to develop new principles and approaches to preventing, diagnosing and treating hard dental tissue pathologies in Type 1 diabetes [34-41].
More comprehensive understanding of the pathogenetic mechanisms behind Type 1 diabetes and its complications, as well as a better idea of the replacement therapy effectiveness, finding promising metabolic preventive drugs, complex treatment and reduced effects of endocrinopathy can be achieved through invasive manipulations or observations only, while these are not applicable to human due to ethical and moral principles [42].
Experimental models are best for studying the pathophysiology of any disease. Compliance with the 3Rs concept (reduction, refinement and replacement) allows taking down the number of animals used in experiments, reducing their physical (psychological) suffering and discomfort [43]. Models of small laboratory animals, rats namely, make a promising choice, which is due to the following reasons: firstly, the nature of the observed changes undergoing in rats, given the modern assessment methods, is generally similar to those in humans; secondly, the wide availability and simplicity in terms of keeping the said animals allow carrying out research projects involving large groups while keeping the economic costs quite low [44].
In recent decades, there have been four main models created to study diabetes and test antidiabetic drugs: 1) surgical – where the pancreas is removed (completely or partially); 2) chemical – associated with using substances that selectively affect the β-cells of the islets of Langerhans; 3) endocrine – involving prolonged administration of adenohypophysis hormones, somatotropic hormone, adrenocorticotropic hormone, or a model where animals are subjected to the introduction of antibodies against insulin; 4) genetic – involving animals with a hereditary type of diabetes mellitus. Even though approaches to the DM modeling methodology have been known for a long time, the experimental methods differ even within one model. At the current stage in experimental diabetes studies, the chemical model of diabetes mellitus with the use of substances destroying β-cells of the islets of Langerhans, has become the most widespread [45-48].
The available data on the dynamics of histological and morphometric changes affecting hard dental tissues during experimental modeling of Type 1 diabetes in laboratory animals are segmentary, scattered and require further research.
Aim of study: to analyze the dynamics of histological and morphometric changes underway in rat dental tissues through experimental modeling of Type I diabetes with streptozotocin.
The experimental part of the study was carried out involving 60 sexually mature male Wistar stock rats (weight – 180-220 g). The rats were randomly divided into two groups, where Group 1 (comparison; n=10) included intact healthy rats; Group 2 rats (main; n=50) were induced experimental DM. The keeping conditions were within the standard vivarium conditions. The air temperature was maintained at 20-24°C; humidity – 45-65%; light mode – 12 hours light/12 hours dark. The animals were allowed 14 days for acclimatization.
The rats were kept in individual cages with free access to drinking water and food. The experiments in terms of the maintenance, feeding and care of the experimental animals, as well as their removal from the experiment and further disposal were carried out in full compliance with Directive 86/609/EEC on the protection of animals used for experimental and other scientific purposes, the rules of the European Convention ET/S 129, and Directive 2010/63/EU of the European Parliament and the Council of the European Union.
The comparison group animals (n=10) received intraperitoneal injection of sodium citrate buffer. The main group rats (n=50) had DM modeled with a single intraperitoneal injection of the diabetogenic substance streptozotocin (AppliChem, Spain) (dosage – 65 mg/kg) dissolved in a freshly prepared cold citrate buffer (pH=4.5, t=+4oC) (Fig. 1).
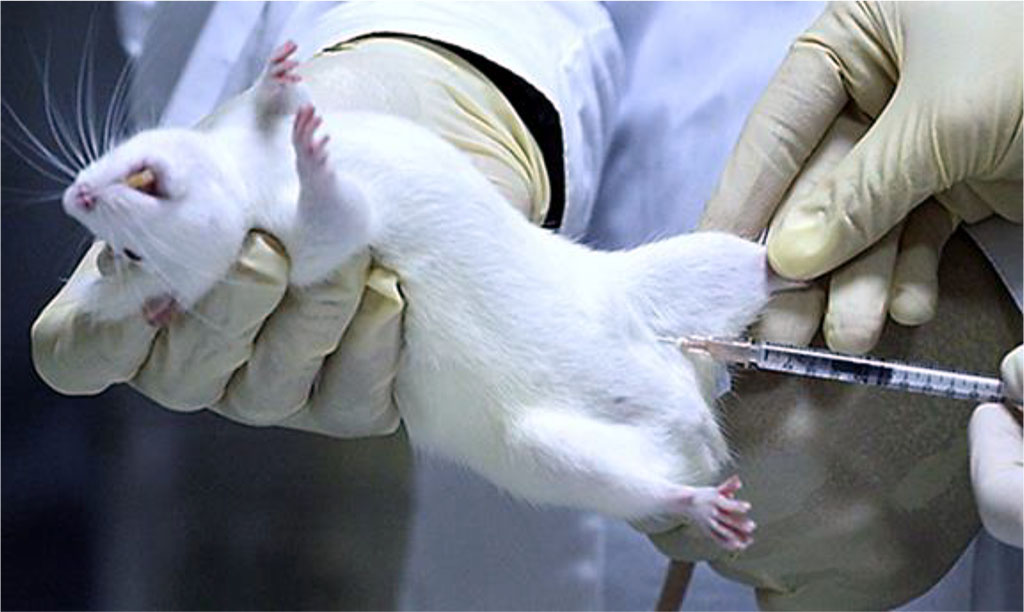
Fig 1. Intraperitoneal injection of streptozotocin done to a laboratory animal (rat).
The disease development in the main group was recorded based on clinical symptoms (polyuria, polydipsia, polyphagia, weight loss) and blood glucose levels after the streptozotocin injection. The criterion for streptozotocin-induced DM was the glycemia level of 9.0 to 14.0 mmol/l, measured in blood plasma with a OneTouch ® Verio ® (Johnson & Johnson) glucometer, the blood taken from the tail vein after no less than 10 hours of starvation (Fig. 2).
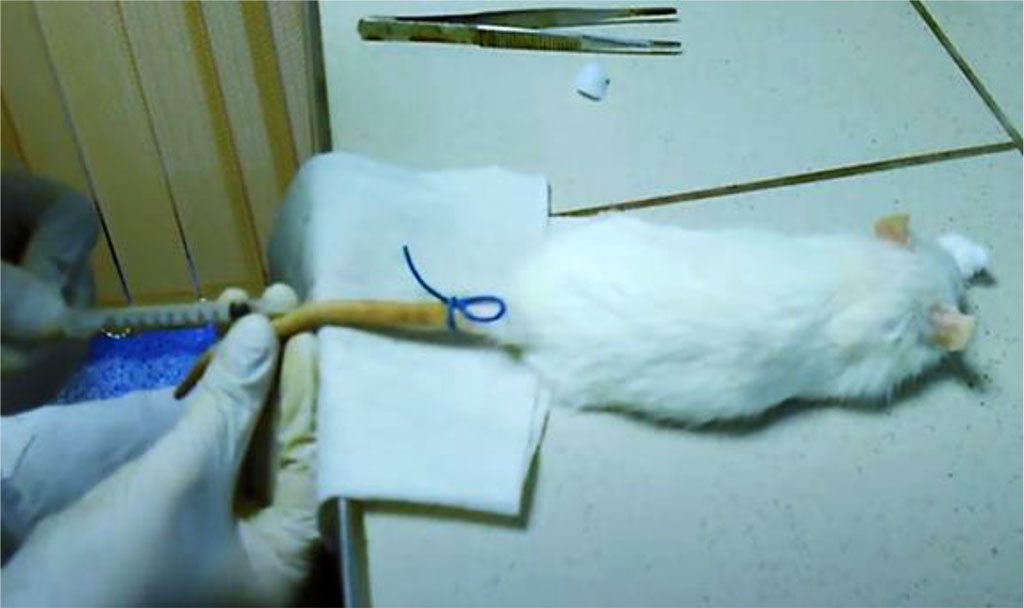
Fig. 2. Blood sampling from a laboratory animal’s (rat) tail vein.
72 hours following the introduction of streptozotocin, the blood glucose levels were measured. The compliance criterion for laboratory animals (rats) comparted with the main group was a glucose level of at least 9.0 mmol/l, whereas the day was considered the starting point of the experiment. The duration of the study was 8-60 days starting from the moment streptozotocin was injected. The main group animals were removed from the experiment on Days 8 (n=10), 16 (n=10), 24 (n=10), 32 (n=10) and 60 (n=10), whereas the comparison group rats (n=10) – on Day 60, under anesthesia by decapitation. A mixture of Zoletil 100 (Virbac, France) and Xylanit was used as a combined anesthesia (dosage – 6 mg/kg of animal body weight) injected (intramuscular) with a disposable insulin syringe. Both drugs are approved to be used in the Russian Federation.
The rats’ upper incisor teeth were used for histological and morphometric studies (Fig. 3).
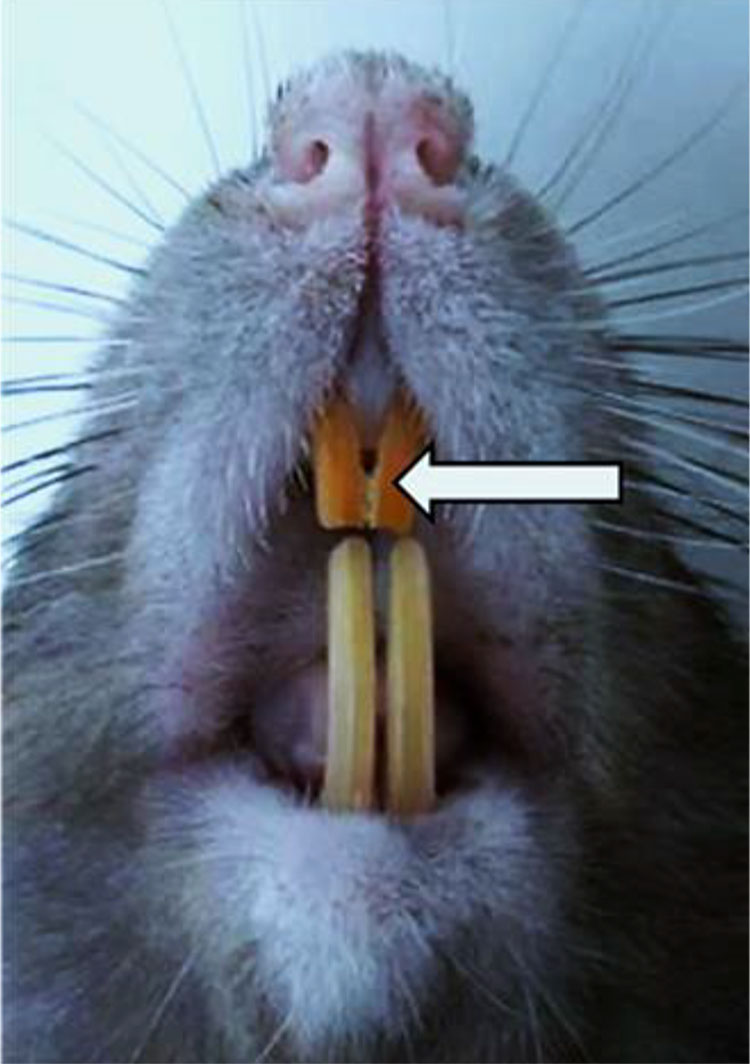
Fig. 3. Laboratory animal’s (rat) upper incisor teeth.
The resulting material was fixed in a 10% neutral buffered formalin solution (for 48 hours). Once the fixation complete, decalcification with trichloroacetic acid was done, for which purpose a 5-10% aqueous solution of trichloroacetic acid with 20% formalin solution added was used (decalcification duration – 4-7 days. The decalcifying fluid was changed every 24 hours. When checking the degree of decalcification of objects, a dissecting needle was used − when the teeth became soft and elastic, the needle could pass easily through the dental tissue. Decalcification with trichloroacetic acid is a more gentle choice if matched against other methods. Decalcification completed, the teeth were washed in 96% alcohol for 4 days (the alcohol was changed daily) and poured into paraffin (Histomix, Biovitrum), using a filling system.
After finishing the treatment and paraffin-pouring, serial sections (5-7 microns) were made with a rotary manually controlled Leica RM2235 microtome (Leica Microsystems, Germany) (Fig. 4).
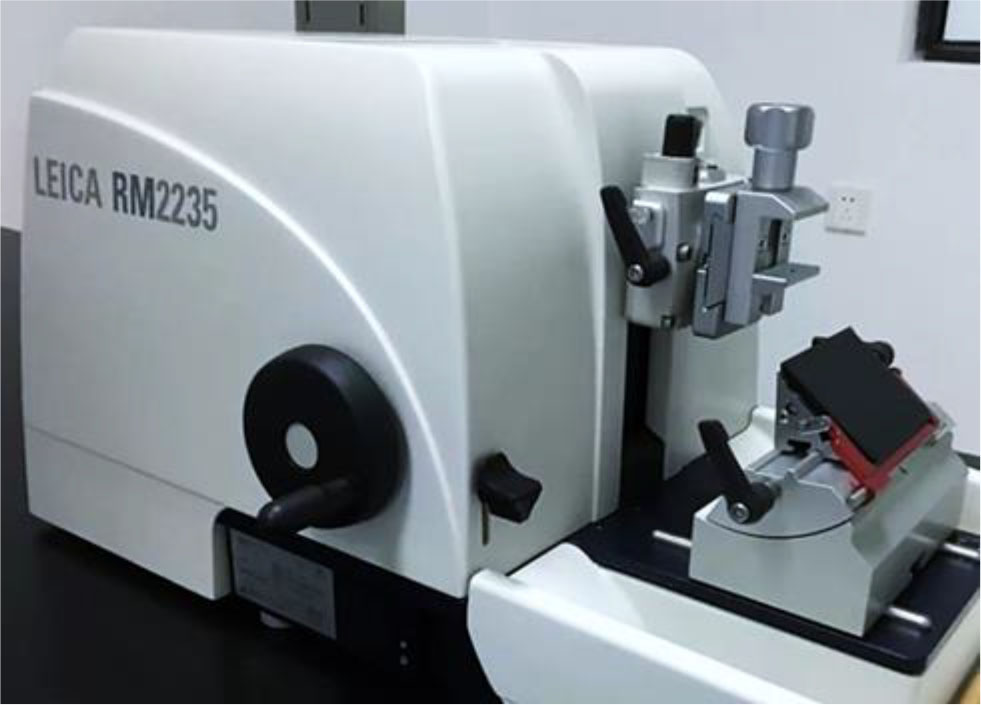
Fig. 4. Leica RM2235 manually controlled rotary microtome
The paraffin sections were stained with hematoxylin and eosin (Biovitrum, Russia), picrofuxin (following Van Gieson) and toluidine blue (by Mallory in Heidenhain modification) using a Raffaello coloring unit (DIAPATH, S.p.A., Italy). The histological examination of the samples was performed using a Leica DM2500 hardware and software set (Leica Microsystems) at a magnification of ×20 − ×1000 (Fig. 5).
Fig. 5. Leica DM2500 laboratory microscope.
Morphometric measurements for quantitative evaluation of histological micro-preparations were carried out in the ImadgeJ software package (National Institutes of Health, USA) on a Leica DM2500 hardware and software set. The studied sections had the following measured within vision: enamel thickness (microns); dentin thickness (microns); predentin thickness (microns); cement thickness (microns); pulp thickness (microns); dentin tubule diameter (microns); density of odontoblasts (units/mm2); density of ameloblasts (units/mm2). The obtained data were processed through standard nonparametric comparison tests using the Statistica for Windows 10.0 (StatSoft, USA) and SPSS Statistics 23.0 (StatSoft Inc., USA) software packages. All the data was presented as mean value ± standard deviation. The differences were considered significant at p < 0.05.
The histological examination of the dental longitudinal sections of the comparison group showed that hard dental tissues (enamel, dentin, cement) and tooth pulp revealed the following morphological features (Fig. 6).
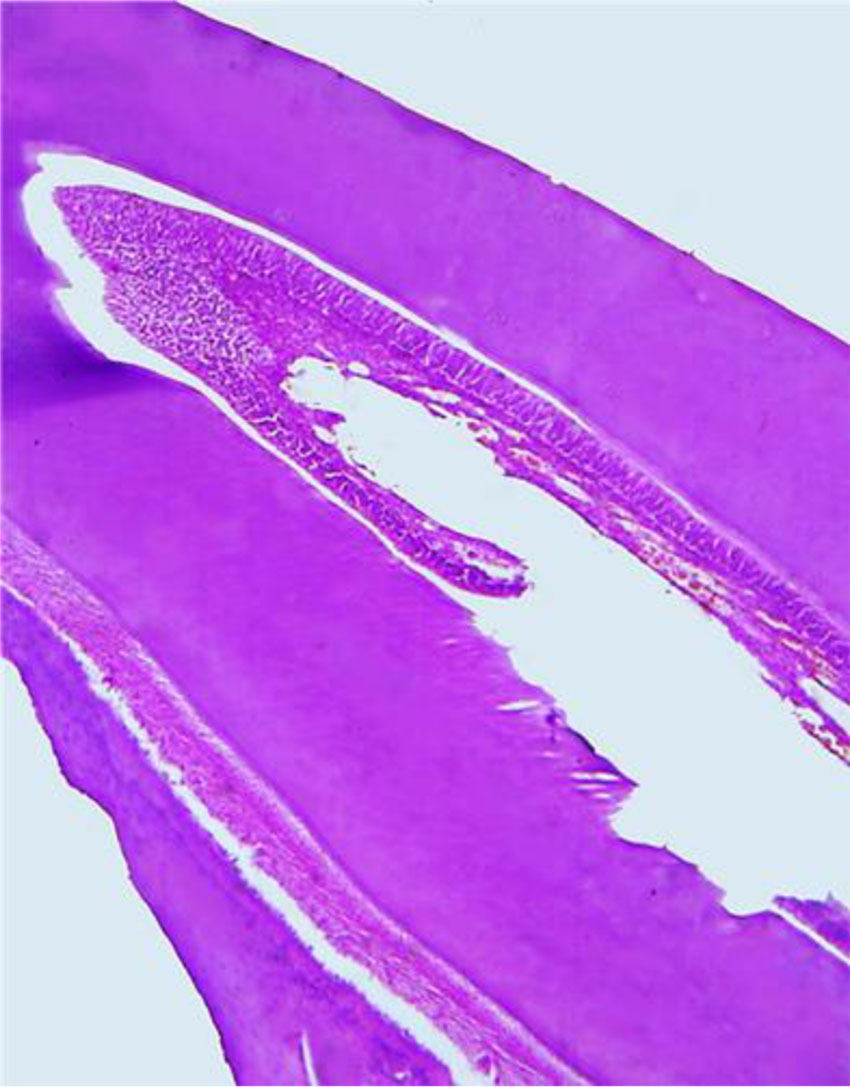
Fig. 6. Histological structure of a comparison group rat tooth (×200, hematoxylin-eosin stained).
The tooth enamel prisms consist of a thin fibrillar network with hydroxyapatite crystals. The beams formed from enamel prisms are perpendicular to the dentin surface and are curved. The interprism space in the enamel is filled with an adhesive substance. Enamel, which features the highest strength, if compared with dentin, covers the tooth crown. The cuticle on top of the tooth enamel predominates on the dental contact surfaces. The surface layer of enamel appears as a uniform pink structure; the enamel prisms are arranged uniformly in parallel rows (Fig. 7).
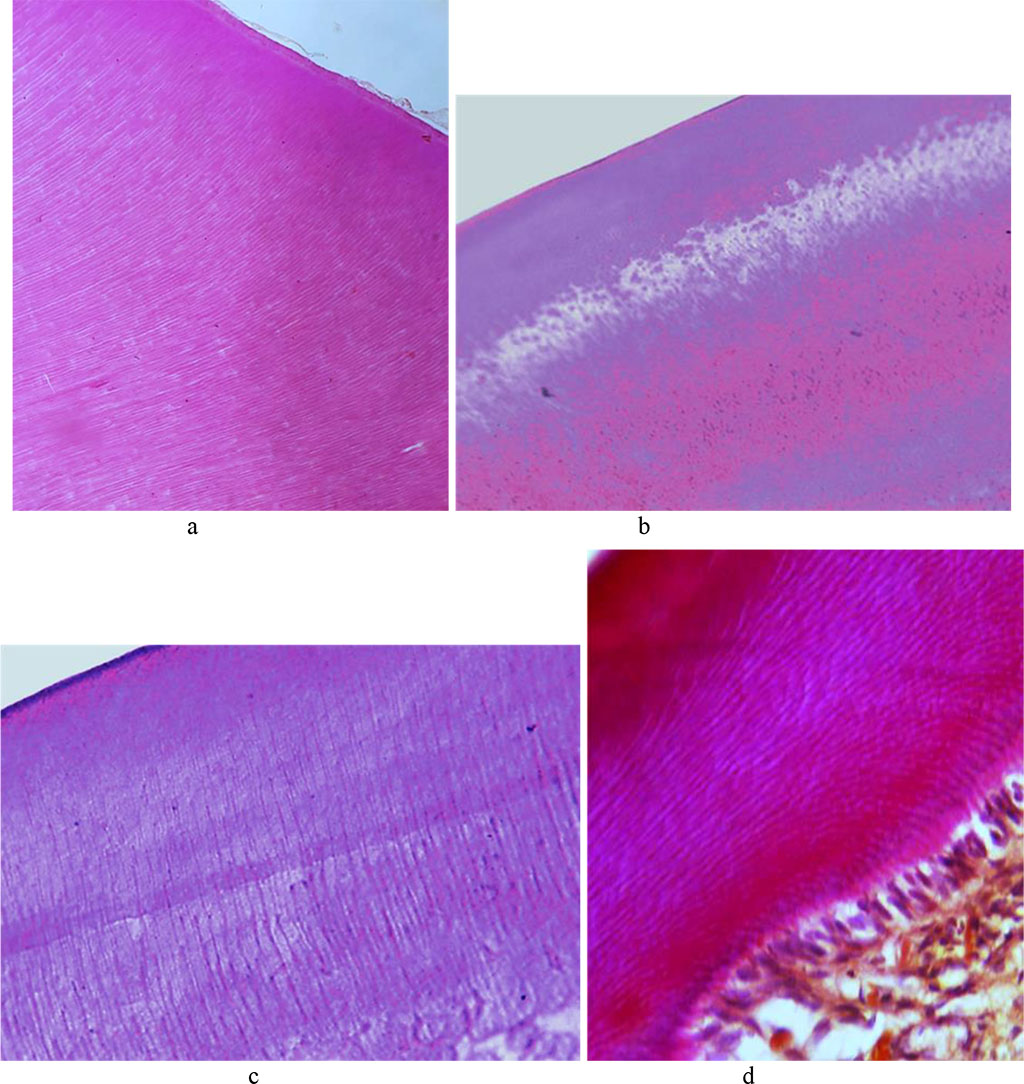
Fig. 7. Histological structure of the comparison group rat dental enamel prisms: a, b − ×200, hematoxylin-eosin staining; c − ×800, hematoxylin-eosin staining; d − ×800, picrofuxin staining by Van Gieson.
Dentin, consisting of the main substance and dentin tubules, is to be found at the crown, neck and root of the tooth. Collagen fibrils, which are part of dentin main substance, make up bundles. Collagen bundles run both radially and tangentially, while the space between the bundles is filled with high-molecular glycoproteins (mucins). Histological examination of the dental longitudinal sections in the comparison group showed clearly cover and peripulpar dentin. The cover dentin contains collagen fibers with a radial direction, which are dominant and run parallel to the dentin tubules. At the circumpulpar dentin, radial fibers come together into cone-shaped tapering bundles, which – from the crown tip to the root – change their initial original radial direction to make it more oblique, which approaches the course of tangential fibers.
The cover dentin matrix is less mineralized than the matrix of the circumpulpar dentin and contains relatively fewer collagen fibers. Between collagen fibers, on their surface as well as inside fibrils themselves there are crystals to be found shaped as grains, which merge into spherical formations (globules). The cover dentin passes gradually into the circumpulpar dentin, where, along with radial fibers, there are numerous fibers located parallel to the pulp surface. In the circumpulpar dentin that accounts for most of the dentin, the fibers run tangentially to the dentin-enamel border and perpendicular to the dentin tubules.
The dentin periphery shows interglobular spaces, which are uncalcified areas looking like cavities with uneven spherical surfaces. The dentin tubules ensuring its trophism penetrate the dentin running radially from the pulp to its periphery, thus adding it striation. In the circumpulpar dentin, the dentin tubules are straight, while in the cover dentin they have a V-shaped terminal branching. The dentin tubules contain processes of odontoblasts, as well as nerve fibers surrounded by tissue fluid. The space between the dentin and the predentin (odontoblasts) is uncalcified dentin (Fig. 8).
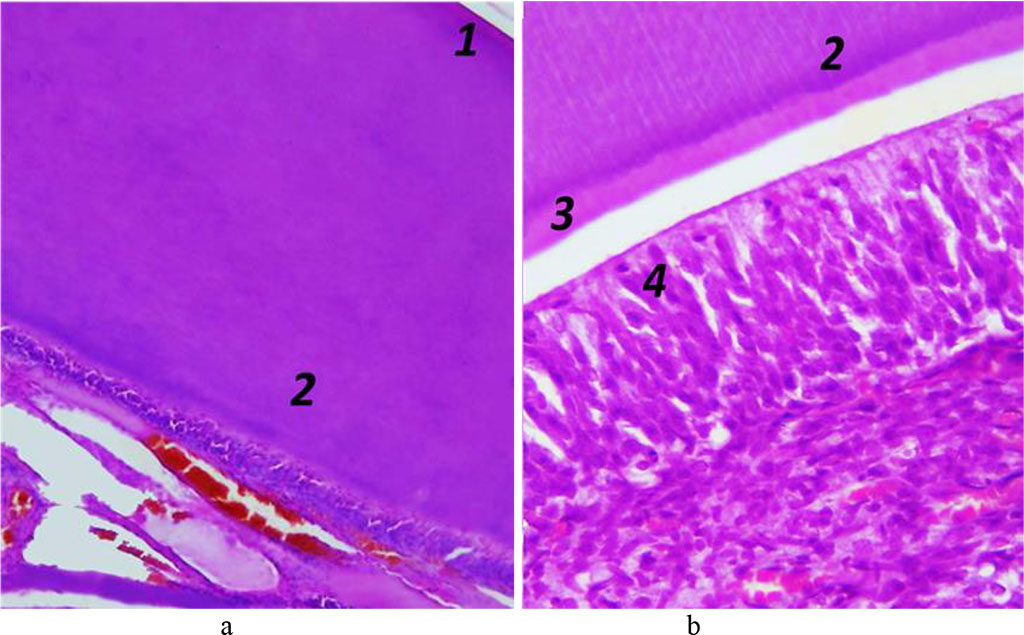
Fig. 8.
Histological
structure of rat dentin, the comparison group: 1 – cover dentin; 2
– circumpulpar dentin; 3 – predentin; 4 – odontoblasts (a −
×200, hematoxylin-eosin staining;
b − ×600, hematoxylin-eosin
staining).
Cement covers the dentin of the completely tooth root from the neck to the tip. Cement, which is identical to rough fibrous bone tissue, is of two types – cell-free and cellular. Cell-free cement is on the root surface appearing as a thin layer that thickens from the cement-enamel border towards the tooth tip. Cell-free cement contains no cells and consists of tightly packed collagen fibers and an amorphous bonding agent. Cellular cement covers the apical third of the root and is located over the cell-free cement, and in case there is no latter, it joins the dentin. Cellular cement consists of cells (cementocytes, cementoblasts) and tightly packed collagen fibers. Cementocytes located in lacunae are flattened cells with moderately developed organelles and a large nucleus, connected to each other by branching processes, which are to be found in the tubules and are oriented towards the periodontium. Cementoblasts are located on the cement surface as part of the periodontium, and are active cells with a developed synthetic apparatus ensuring the deposition of new cement layers (Fig. 9.10).
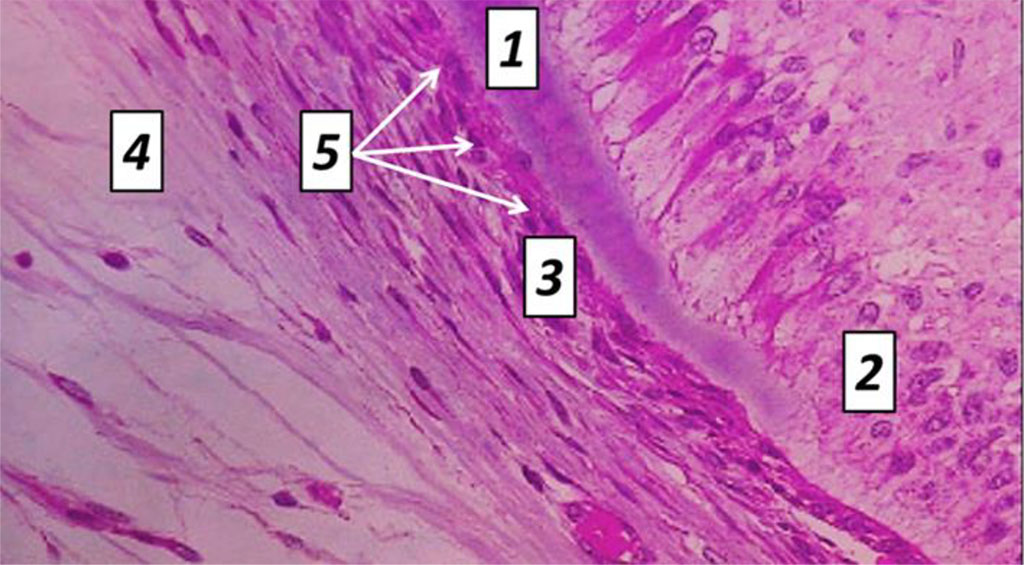
Fig. 9. Histological structure of rat tooth cement, the comparison group: 1− dentin; 2 – odontoblasts; 3 − cellular cement; 4 – cell-free cement; 5 – cementocytes (×1200, hematoxylin-eosin staining).
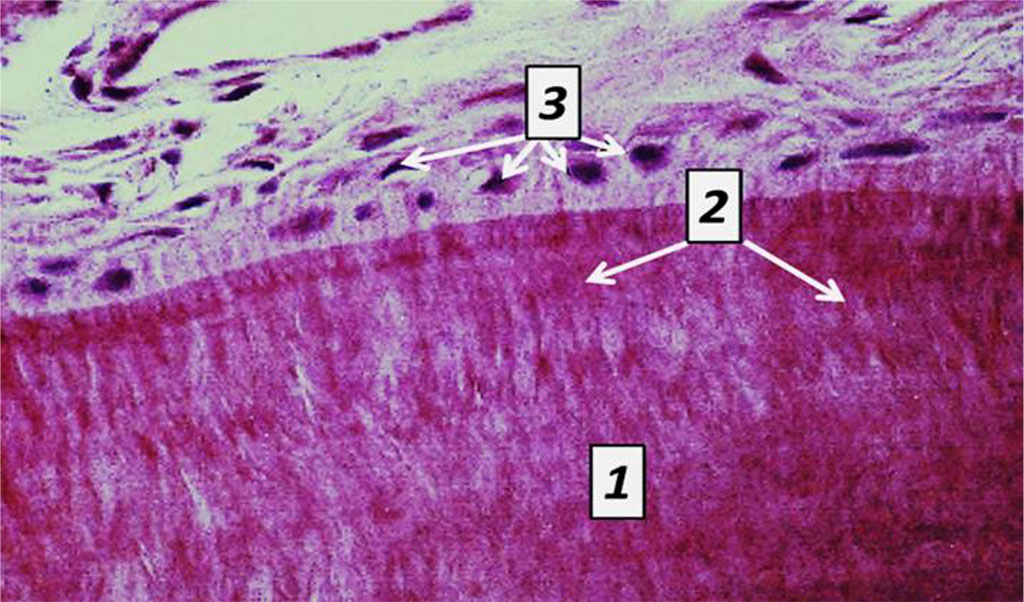
Fig. 10. Histological structure of rat tooth cement, the comparison group: 1− cell–free cement; 2 – Sharpey’s fibers; 3 – cementoblasts (×1200, hematoxylin-eosin staining).
Pulp is what fills the tooth cavity and can be divided into crown pulp and root pulp. Pulp is a specific loose fibrous connective tissue with a network of collagen fibers, which is abundantly vascularized and innervated. By the cellular composition, three layers are to be seen in the tooth pulp. The peripheral layer consists of 1-8 rows odontoblasts or dentinoblasts. Odontoblasts are pear-shaped, have multiple processes and are with basophilic cytoplasm. The nucleus of odontoblasts is located basally, while its long process derives from the apical part of the cell and enters the dentin tubule. The interlayer located in the crown pulp is an outer (cell-free) zone with processes of cells whose bodies are located in the inner zone; nerve fibers; blood capillaries, as well as an inner (cellular) zone with small stellate (spindle-shaped) cells connected by processes that can differentiate into fibroblasts, macrophages, and odontoblasts. The central layer is a loose fibrous connective tissue containing histiocytes (cells with a large nucleus and a narrow rim of cytoplasm) (Fig. 11,12).
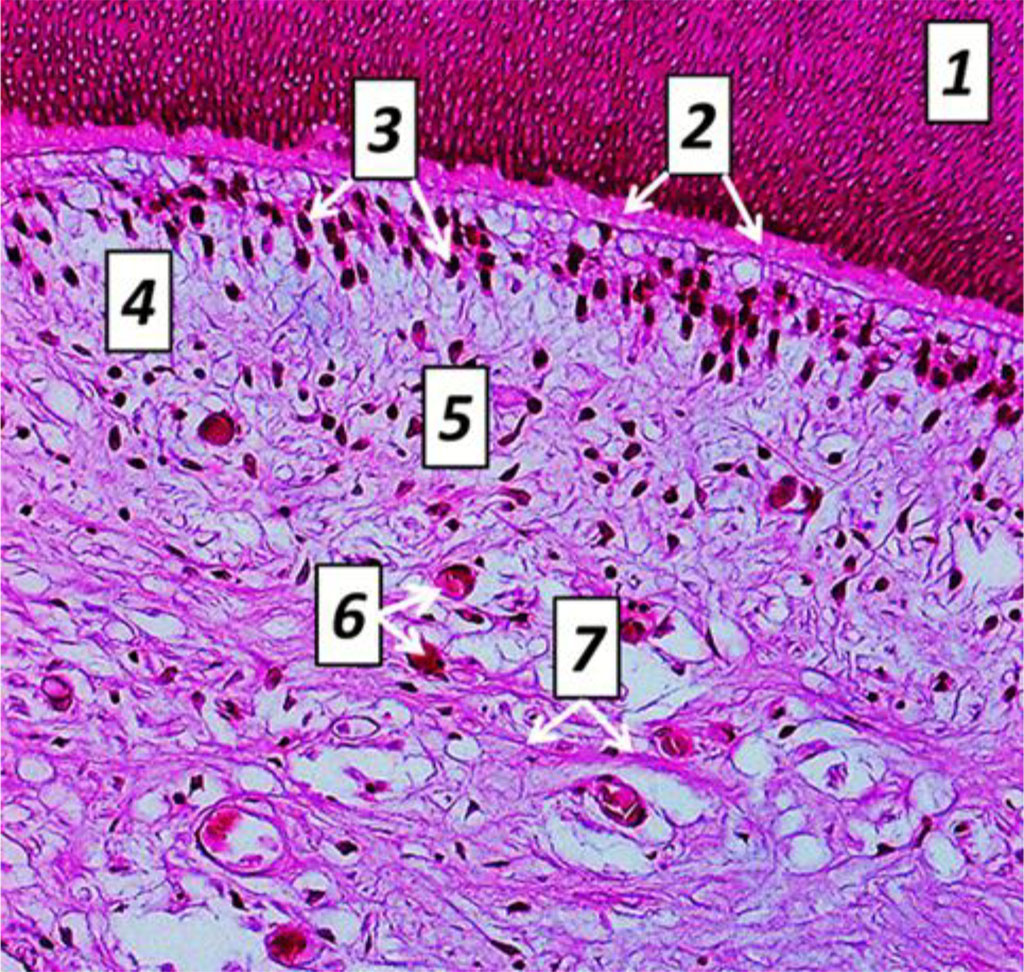
Fig. 11. Histological structure of rat tooth pulp cross-sectio, the comparison group: 1− dentin; 2 – predentin; 3 − odontoblasts; 4 − cell-free cement; 5 – cell cement; 6 – blood capillaries; 7 – nerve fibers (×600, hematoxylin-eosin staining).
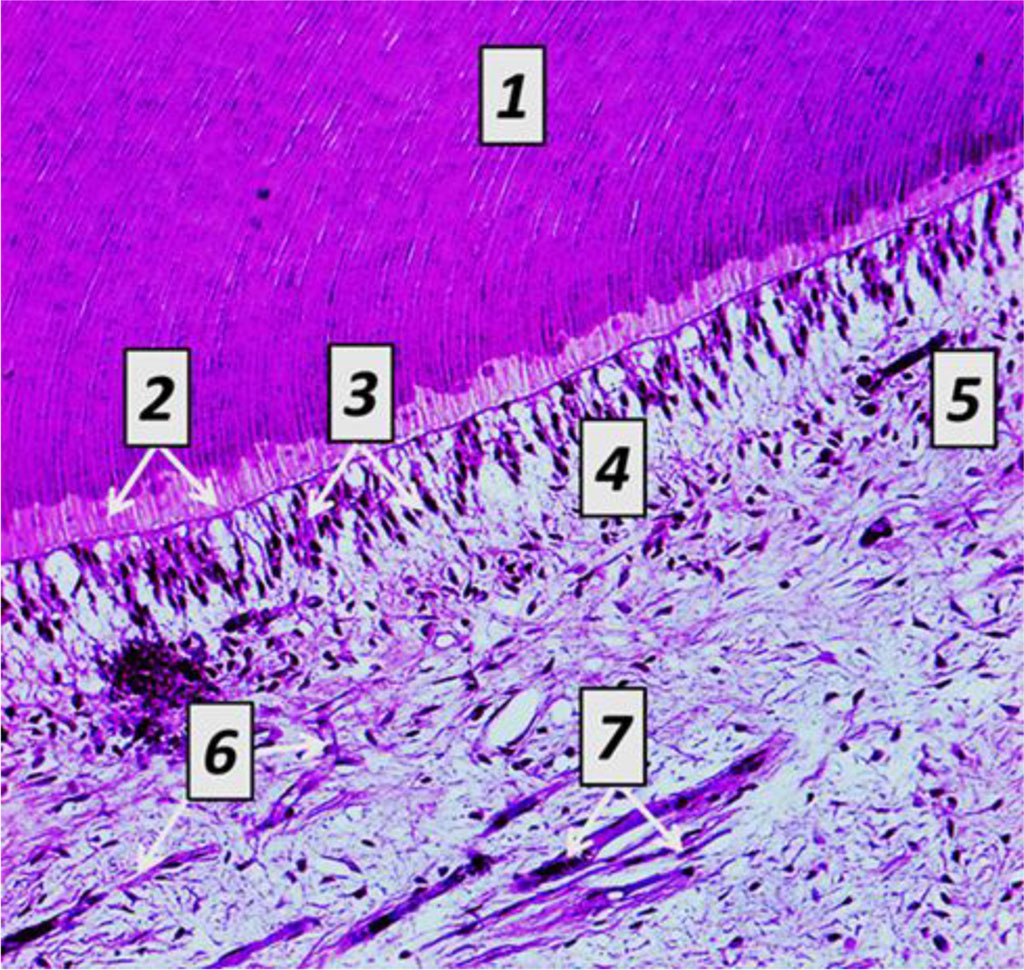
Fig. 12. Histological structure of rat tooth pulp longitudinal section, the comparison group: 1− dentin; 2 − predentin; 3 – odontoblasts; 4 − cell−free cement; 5 – cell cement; 6 – blood capillaries; 7 – nerve fibers (×600, hematoxylin-eosin staining).
Table 1,2 shows the morphometric parameters of tooth tissues obtained through histological studies from the laboratory rats in the studied groups.
Table 1. Morphometric parameters of laboratory rats tooth tissues, the comparison group, (p<0.05)
| Indicators, units of measurement | Morphometrics |
| Enamel thickness, micron | 31.06 ± 2.17 |
| Dentin thickness, micron | 96.54 ± 3.39 |
| Predentin thickness, micron | 25.19 ± 1.48 |
| Cement thickness, micron | 37.28 ± 2.04 |
| Pulp thickness, micron | 107.43 ± 4.12 |
| Dentin tubule diameter, micron | 1.82 ± 0.14 |
| Density of odontoblasts, u/mm2 | 7683.24 ± 319.76 |
| Density of ameloblasts, u/mm2 | 6471.39 ± 272.18 |
As the quantitative assessment of morphometric values of comparison group tooth tissues shows, the enamel thickness is 31.06±2.17 microns, the dentin thickness is 96.54±3.39 microns, the predentin thickness is 25.19±1.48 microns, the cement thickness is 37.28±2.04 microns, the pulp thickness is 107.43±4.12 microns, the dentin tubule diameter is 1.82±0.14 microns, the density of odontoblasts is 7683.24 ±319.76 units/mm2, and the density of ameloblasts is 6471.39 ± 272.18 units/mm2.
Table 2. Morphometric parameters of tooth tissues in the main group rats, (p<0.05)
| Indicators, units of measurement | Term of study | ||||
| Day 8 | Day 16 | Day 24 | Day 32 | Day 60 | |
| Enamel thickness, micron | 30.59 ± 1.94 ⃰ | 29.37 ± 2.03 ⃰ | 27.14 ± 1.49 ⃰ | 24.28 ± 1.57 ⃰ | 18.19 ± 1.36 ⃰ |
| Dentin thickness, micron | 96.76 ± 3.82 ⃰ | 97.28 ± 3.26 ⃰ | 98.09 ± 2.94 ⃰ | 101.36 ± 2.79 ⃰ | 105.11 ± 3.16 ⃰ |
| Predentin thickness, micron | 25.07 ± 1.62 ⃰ | 24.48 ± 1.36 ⃰ | 23.51 ± 1.22 ⃰ | 22.19 ± 1.51 ⃰ | 20.93 ± 1.16 ⃰ |
| Cement thickness, micron | 36.91 ± 2.27 ⃰ | 36.24 ± 1.91 ⃰ | 35.02 ± 1.76 ⃰ | 33.65 ± 2.13 ⃰ | 31.04 ± 1.46 ⃰ |
| Pulp thickness, micron | 108.59 ± 3.75 ⃰ | 110.46 ± 3.93 ⃰ | 113.77 ± 4.54 ⃰ | 115.61 ± 4.17 ⃰ | 120.38 ± 5.26 ⃰ |
| Dentin tubule diameter, micron | 1.81 ± 0.11 ⃰ | 1.78 ± 0.17 ⃰ | 1.72 ± 0.12 ⃰ | 1.68 ± 0.09 ⃰ | 1.56 ± 0.13 ⃰ |
| Density of odontoblasts, u/mm2 | 7649.07 ± 340.51 ⃰ | 7594.92 ± 285.08 ⃰ | 7526.43 ± 303.15 ⃰ | 7459.24 ± 279.63 ⃰ | 7312.61 ± 256.19 ⃰ |
| Density of ameloblasts, u/mm2 | 6502.24 ± 293.07 ⃰ | 6556.41 ± 258.62 ⃰ | 6623.82 ± 269.49 ⃰ | 6714.03 ± 288.35 ⃰ | 6849.06 ± 253.84 ⃰ |
Note: ⃰ − statistical significance of the differences in relation the comparison group indicators (p<0.05).
Subject to the histological examination results, the main group laboratory rats’ teeth featured no structural changes in the hard tissues on Day 8 of the experiment. The dental enamel retained clear contours of prisms. The enamel cuticle remained intact. The dentin tubules were smooth, their lumen not expanded. Odontoblasts had no pathological change. Collagen fibers and cementocytes were clearly visible in the cell-free cement. There was obvious diffuse venous-capillary blood fullness observed in the pulp; erythrostases with diapedetic microhemorrhages, and the edema between odontoblasts and in perivascular spaces (Fig. 13).
 c
c
Fig. 13. Pathomorphological changes affecting dental tissues, the main group laboratory rats, Day 8 of the experiment: a − the initial stage of edema between odontoblasts; b − focal perivascular hemorrhages; c − diffuse venous-capillary blood fullness (×600, hematoxylin-eosin staining).
The quantitative analysis of tooth tissue morphometric parameters carried out in the main group on Day 8 of the experiment indicated that the enamel thickness was 30.59±1.94 microns, the dentin thickness − 96.76±3.82 microns, the predentin thickness − 25.07±1.62 microns, the cement thickness − 36.91±2.27 microns, the pulp layer thickness − 108.59±3.75 microns, the dentin tubule diameter − 1.81± 0.11 microns, the odontoblast density − 7649.07±340.51 units/mm2, whereas the ameloblast density was 6502.24±293.07 units/mm2.
The histological study data obtained examining the main group rats on Day 16 day of the experiment revealed no structural changes in the hard dental tissues. There were vacuoles with tissue fluid (vacuolization) visualized in the cytoplasm of odontoblasts, with some signs of vacuole dystrophy to be observed. The intensity of hemodynamic disorders in the tooth pulp increased, the edema was growing and spreading to cover over ½ of the pulp. Multiple diapedetic microhemorrhagias were identified (Fig. 14).
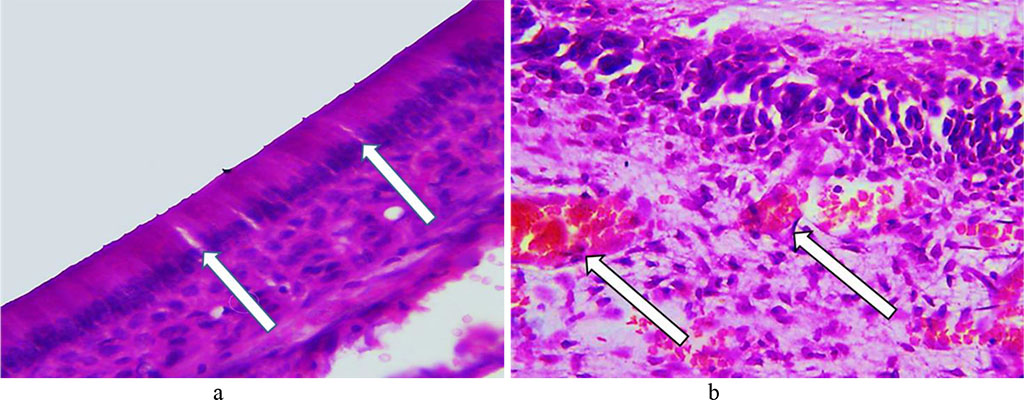
Fig. 14. Pathomorphological changes in the dental tissues, the main group rats, Day 16 of the experiment: a – signs of vacuole dystrophy affecting odontoblasts (×600, hematoxylin-eosin staining); b − multiple diapedetic microhemorrhagia (×800, hematoxylin-eosin staining).
Morphometric characteristics of tooth tissues from the main group rats on Day 16 of the experiment showed that the enamel thickness was 29.37±2.03 microns, the dentin thickness was 97.28±3.26 microns, the predentin thickness was 24.48±1.36 microns, the cement thickness – 36.24±1.91 microns, the pulp thickness – 110.46±3.93 microns, the diameter of dentin tubules – 1.78± 0.17 microns, the odontoblast density − 7594.92 ±285.08 units/mm2, and the ameloblast density − 6556.41± 258.62 units/mm2.
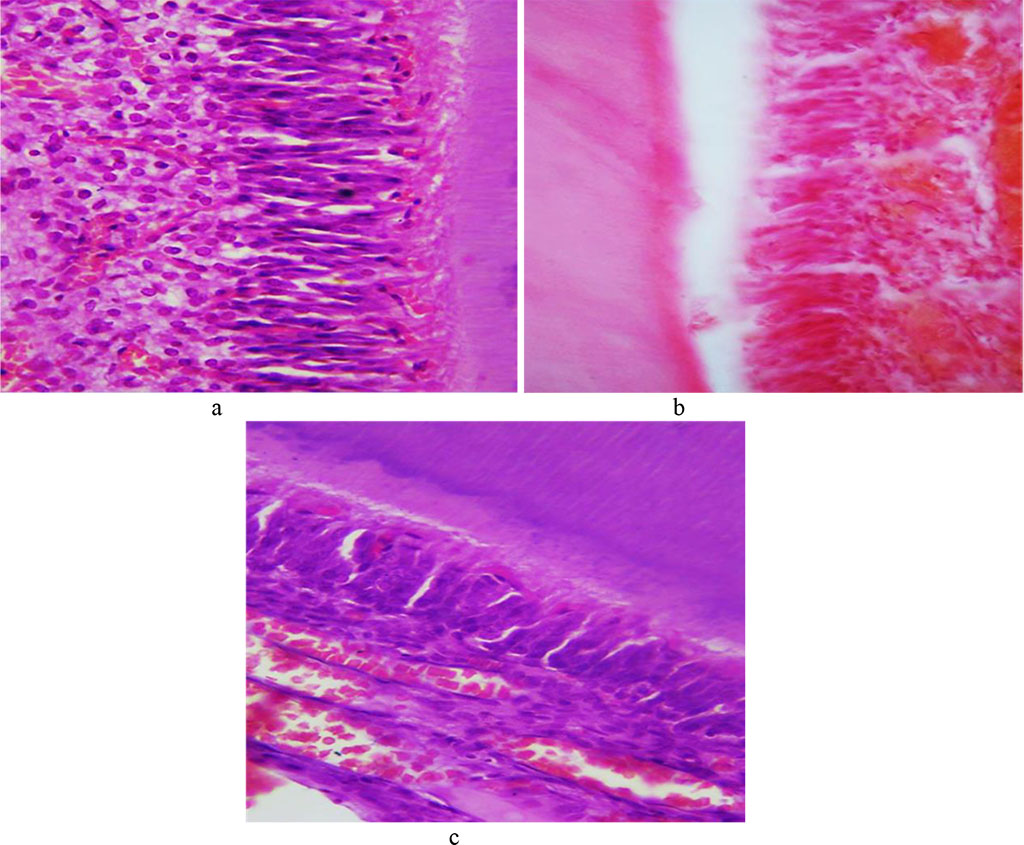
On Day 24 of the experiment, as histological studies in the main group showed, there could be early morphological changes visualized in the rats’ hard dental tissues. The enamel prisms revealed some foci of the interprism substance decay appearing between them with narrow slits developing. The enamel prisms partially lost their compactness arrangement, while the size of the enamel prisms was observed to be going down. The said changes are local by their nature, which leads to uneven erasure of the pattern (Fig. 15).
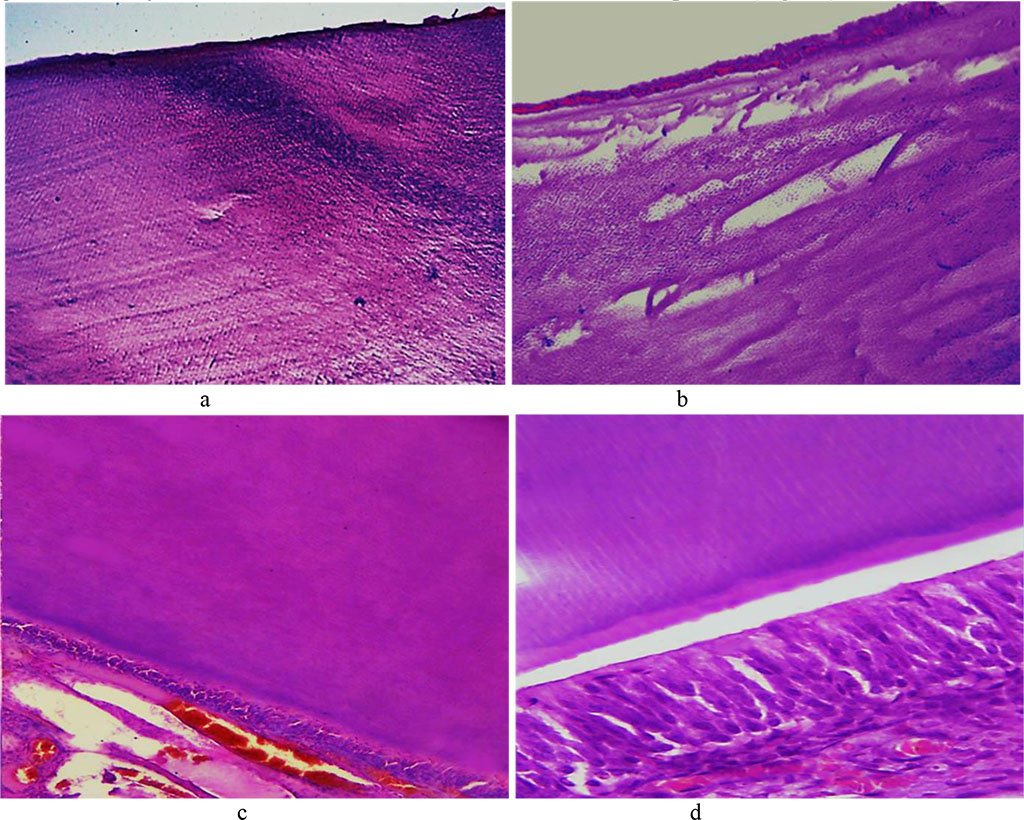
Fig. 15. Pathomorphological changes in the tooth enamel, the main group rats, Day 24 day of the experiment: a – disturbed structure of the enamel prisms appearing as dark blue areas in the enamel surface layers (×100, hematoxylin-eosin staining); b – local defects of the enamel surface featuring cavity foci of destruction in the subsurface layer (×200, staining with hematoxylin-eosin); c – unevenly erasing enamel prism pattern (×200, hematoxylin-eosin staining); d – unevenly erasing enamel prism pattern (×600, hematoxylin-eosin staining).
On Day 24, the predentin featured erased pattern and expanding lumen of the dentin tubules. Numerous vacuoles could be detected in the cytoplasm of odontoblasts. The number of odontoblasts bearing signs of vacuole dystrophy was increasing. In some areas, there was an edematous fluid accumulating under the odontoblast layer (Fig. 16).
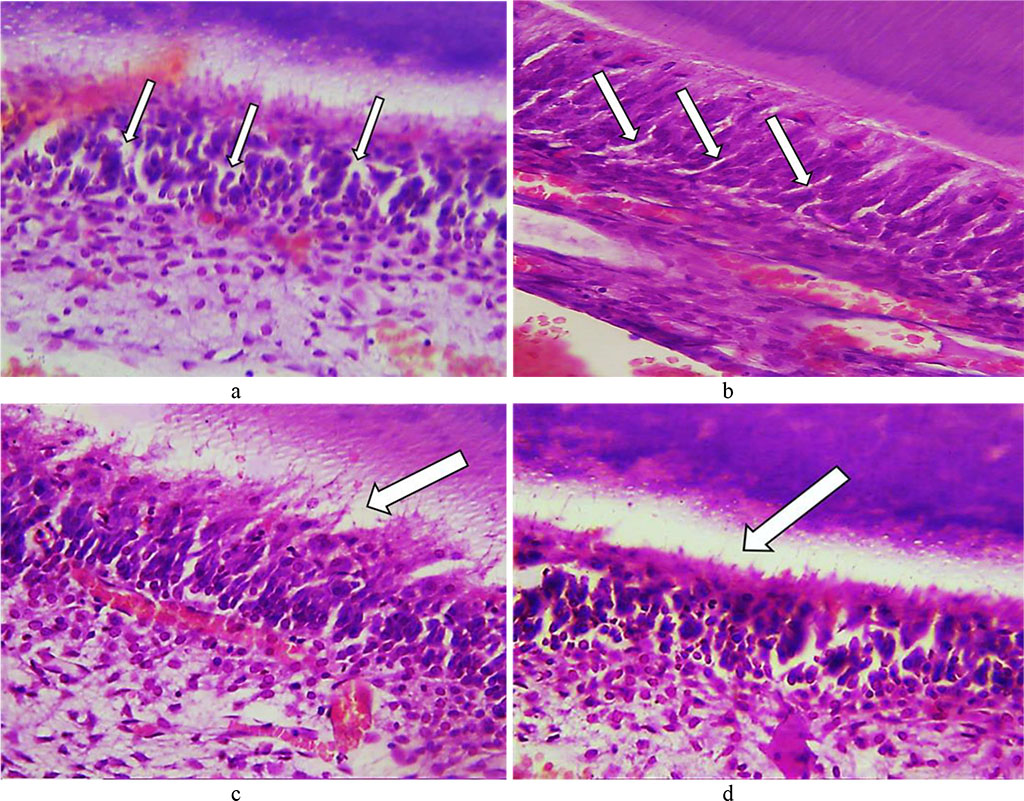
Fig. 16. Pathomorphological changes in the dental tooth tissues, the main group rats, Day 24 of the experiment: a – numerous vacuoles in the cytoplasm of odontoblasts (×400, hematoxylin-eosin staining); b – vacuolization of the cytoplasm of odontoblasts (×800, hematoxylin-eosin staining); c, d – accumulation of edematous fluid under odontoblasts (×400, hematoxylin-eosin staining).
On Day 24 of the experiment, brightening foci and small areas of cementolysis were to be observed in the tooth cement. The cellular cement had some signs of vacuole dystrophy of cementocytes. The dental pulp featured some hemodynamic disorders, a spreading moderate edema, disarrangement (swelling, decay) of the main substance with accumulating glycosaminoglycans and areas of metachromasia (Fig. 17).
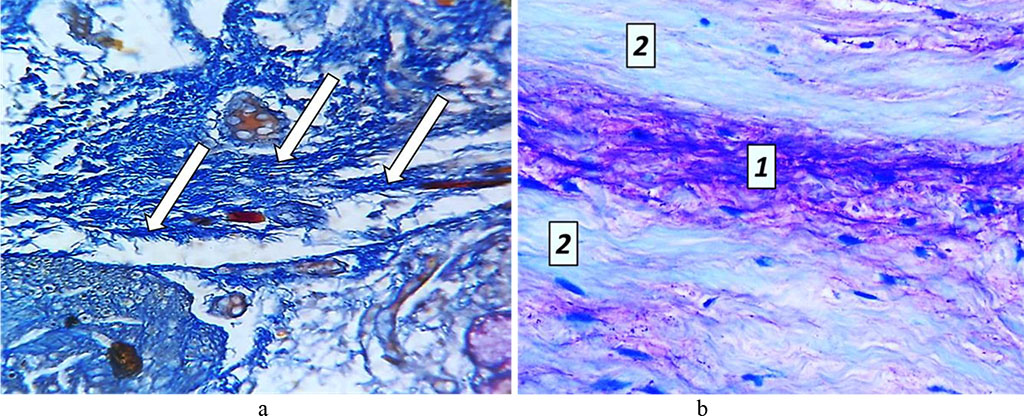
Fig. 17. Pathomorphological changes in the tooth pulp, the main group rats, Day 24 of the experiment: a – accumulation of glycosaminoglycans (×200, Mallory staining); b – metachromasia phenomenon: 1 – areas showing mucoid swelling; 2 − unchanged structure of collagen fibers (×800, Mallory staining).
The quantitative analysis of morphometric parameters focusing on the tooth tissues of the main group rats, carried out on Day 24 of the experiment, indicated that the enamel thickness was 27.14±1.49 microns, the dentin thickness was 98.09±2.94 microns, the predentin thickness was 23.51±1.22 microns, the cement thickness was 35.02±1.76 microns, the pulp thickness was 113.77±4.54 microns, the diameter of dentin tubules was 1.72±0.12 microns, the odontoblast density − 7526.43±303.15 units/mm2, the ameloblast density being 6623.82±269.49 units/mm2.
The histological examination data related to studying the teeth of the main group rats on Day 32 of the experiment revealed signs of enamel demineralization, the interprism substance destruction, expanded interprism spaces, erasure in the enamel prism contours, due to which the prisms turned uneven and fine-grained. The interprism tissues lost their histological structure and turned into a homogeneous unstructured mass. Reducing the number of hydroxyapatite crystals in the enamel prisms increased the enamel transverse striation. Vacuolization, wrinkling and dystrophic changes could be observed in the enamel prisms. The enamel transparency disappeared, while the organic matrix remained (Fig. 18).
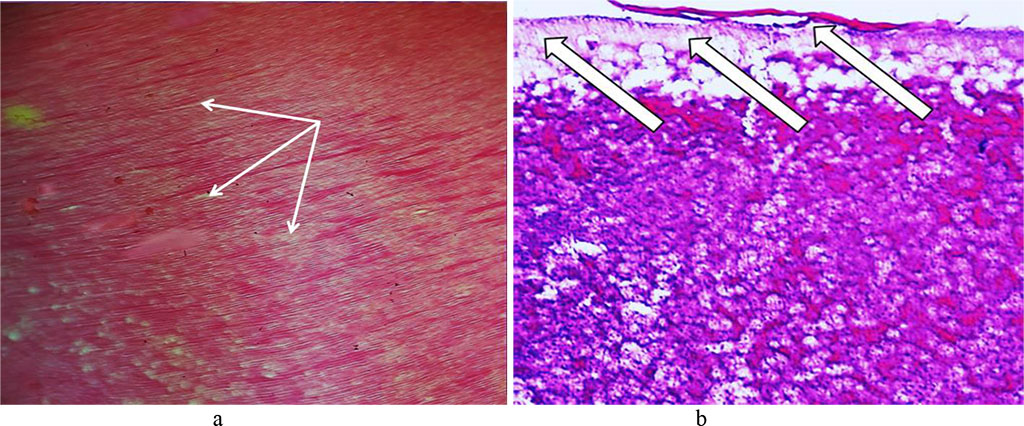
Fig. 18. Pathomorphological changes affecting the tooth enamel, the main group rats, Day 32 of the experiment: a – expanded interprism spaces (×200, hematoxylin-eosin staining); b – foci of disturbed integrity of the enamel surface layer (×400, hematoxylin-eosin staining).
The dentin showed an uneven expansion of its dentin tubules, as well as decaying basic substance with gaps developing between the tubules, the tubules fusing with one another and cavities and cracks developing in the dentin (Fig. 19).
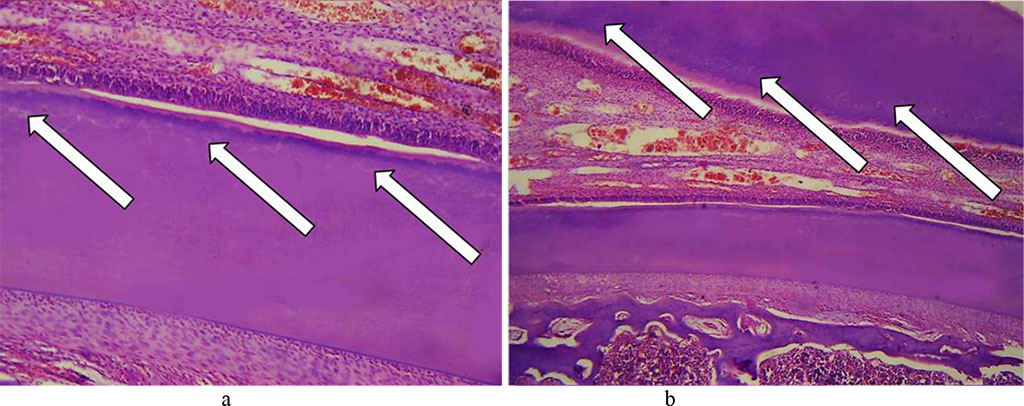
Fig. 19. Pathomorphological changes in the dentin, the main group rats, Day 32 of the experiment: a, b – expanded dentin tubules with cavities developing in the dentin (×200, hematoxylin-eosin staining).
There were numerous vacuoles identified in the cytoplasm of odontoblasts, with balloon dystrophy observed sometimes as an extreme degree of vacuole dystrophy. The odontoblastic layer was found to contain edematous fluid. As a result of compressed odontoblasts, there were certain deformations and irreversible changes (dystrophy, atrophy) affecting odontoblasts, as well as predentin thinning (Fig. 20), detected.
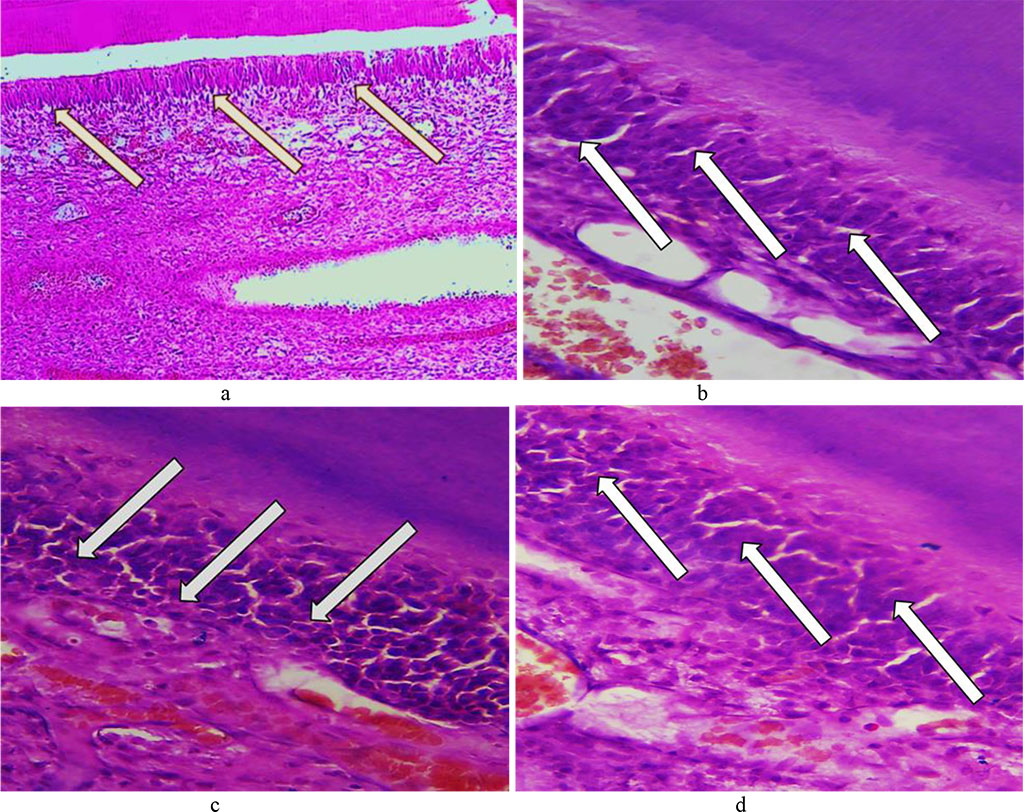
Fig. 20. Pathomorphological changes in the odontoblast layer, the main group rats, Day 32 day of the experiment: a – vacuole dystrophy of odontoblasts (×200, hematoxylin-eosin staining); b – vacuole dystrophy of odontoblasts (×8 00, hematoxylin-eosin staining); c, d – deformation and atrophy of odontoblasts (×800, hematoxylin-eosin staining).
The layer of odontoblasts was found to contain a significant volume of edematous fluid under it with odontoblasts getting detached. The processes of odontoblasts were observed to feature some dystrophic changes and destruction foci (Fig. 21).
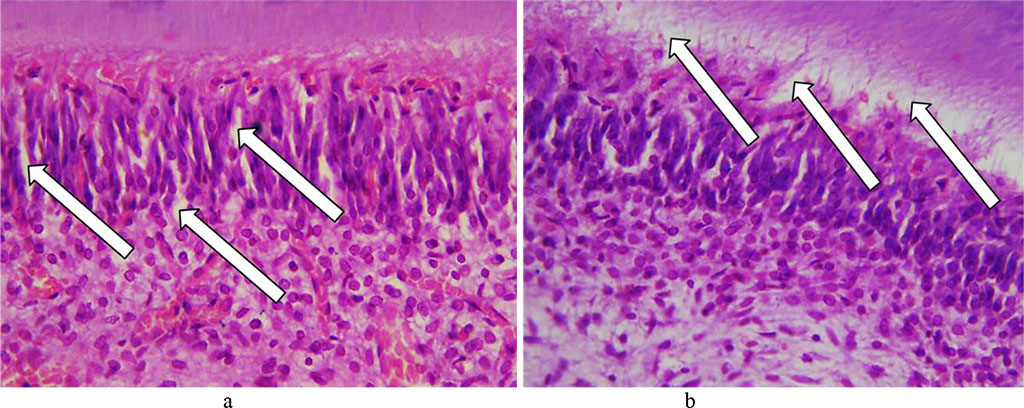
Fig. 21. Pathomorphological changes in the odontoblast layer, the main group rats, Day 32 of the experiment: a – edema in the perivascular spaces and between odontoblasts (×400, hematoxylin-eosin staining); b – accumulation of edematous fluid with odontoblasts getting detached (×400, hematoxylin-eosin staining).
The dental cement revealed to have numerous lysis with developing cavities. The thickness of cellular and non-cellular cement was uneven, with some areas featuring thinning, as well as with cementocytes bearing signs of dystrophic changes. The number and the size of the brightening foci have gone up (Fig. 22).
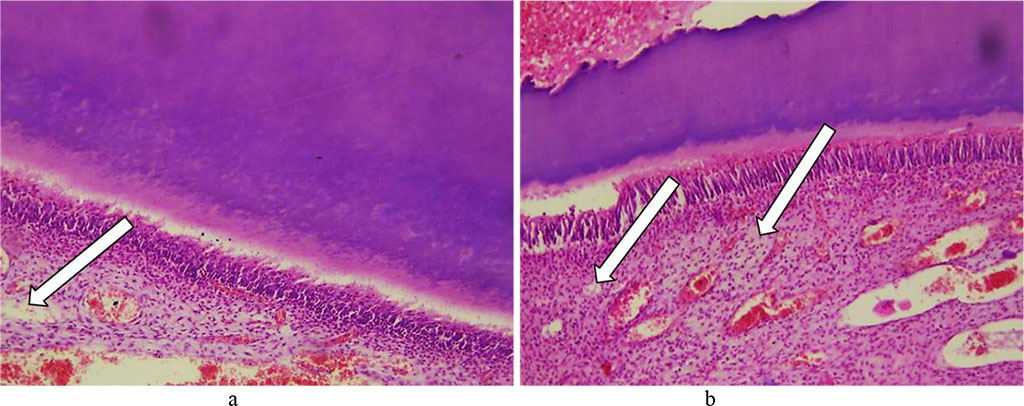
Fig. 22. Pathomorphological changes in the tooth cement, the main group rats, Day 32 of the experiment: a, b – foci of lysis in cellular and non-cellular cement with developing cavities (×200, hematoxylin-eosin staining).
Certain reactive changes could be observed in the tooth pulp, namely, significant diffuse fullness and swelling of blood vessels; edematous fluid accumulating between collagen fibers with cracks and cavities developing; stasis; diapedetic hemorrhages; inflammatory infiltration. Compression of collagen fibers by edematous fluid resulted in pulp atrophy along with small cysts developing. The cellular elements of the pulp are deformed, taking some stellate shape, whereas glycosaminoglycans accumulate (Fig. 23).
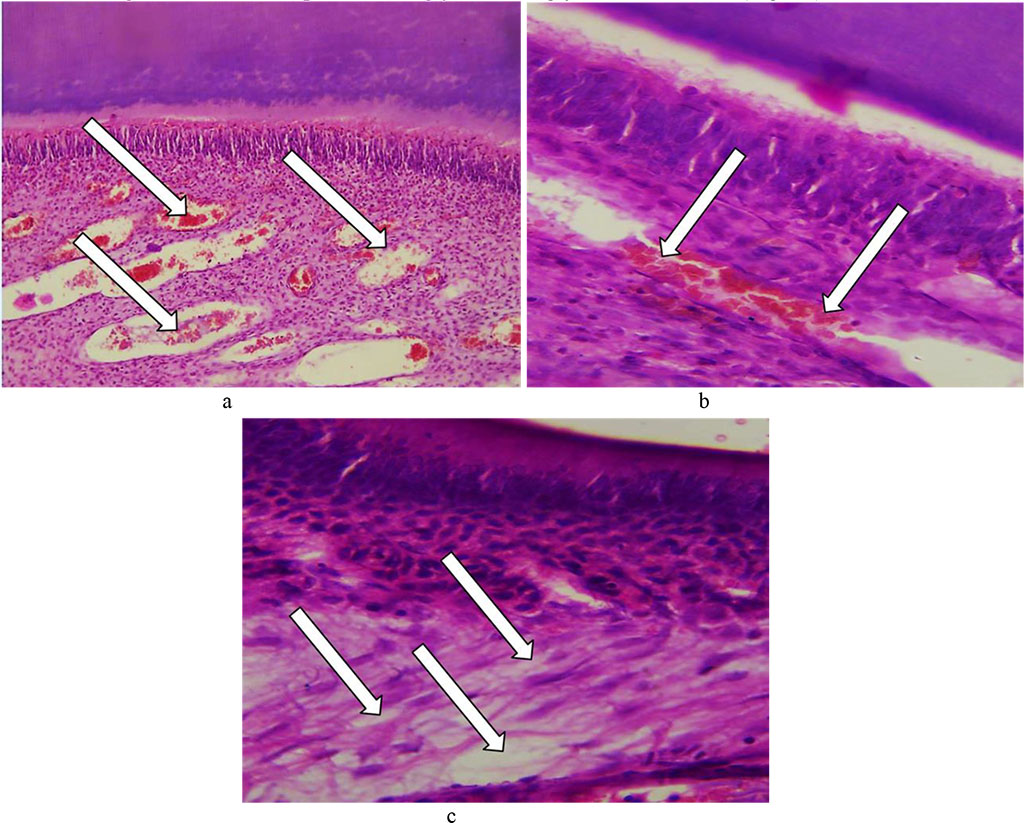
Fig. 23. Pathomorphological changes in the tooth pulp, the main group rats, Day 32 of the experiment: a – significant diffuse fullness and edema with cavities developing (×200, hematoxylin-eosin staining); b – stasis, fullness of vessels with diapedetic hemorrhages (×800, hematoxylin-eosin staining); c –edematous fluid accumulation in the perivascular spaces and between connective tissue fibers (×800, hematoxylin-eosin staining).
The analysis of morphometric characteristics observed in the dental tissues of the main group laboratory rats on Day 32 of the experiment showed that the enamel thickness was 24.28±1.57 microns, the dentin thickness was 101.36±2.79 microns, the predentin thickness – 22.19±1.51 microns, the cement thickness – 33.65±2.13 microns, the pulp thickness – 115.61±4.17 microns, the diameter of dentin tubules – 1.68± 0.09 microns, the odontoblast density − 7459.24 ± 279.63 units/mm2, the ameloblast density being 6714.03±288.35 units/mm2.
The data obtained through histological examination of the main group rats’ teeth on Day 60 of the experiment, showed progression of dystrophic and destructive processes affecting the tooth enamel. The dental enamel surface layer was unclear in many areas, while there were foci of destruction identified, which appeared as irregularly shaped clusters. Disturbed structural arrangement of enamel manifested itself in the following ways: the enamel prisms were deformed, with their size reduced; the interprism adhesive was destroyed; the number and the size of the gaps between the enamel prisms was increased; the enamel prisms were deformed and wrinkled, which leads to an erased pattern; there were demineralization foci observed, which appeared as pores or somewhat soft and loosening areas. Due to the demineralization, there were defects identified in the basal part appearing as erosions, pores, and soft areas of loosening or brightening substance (Fig. 24).
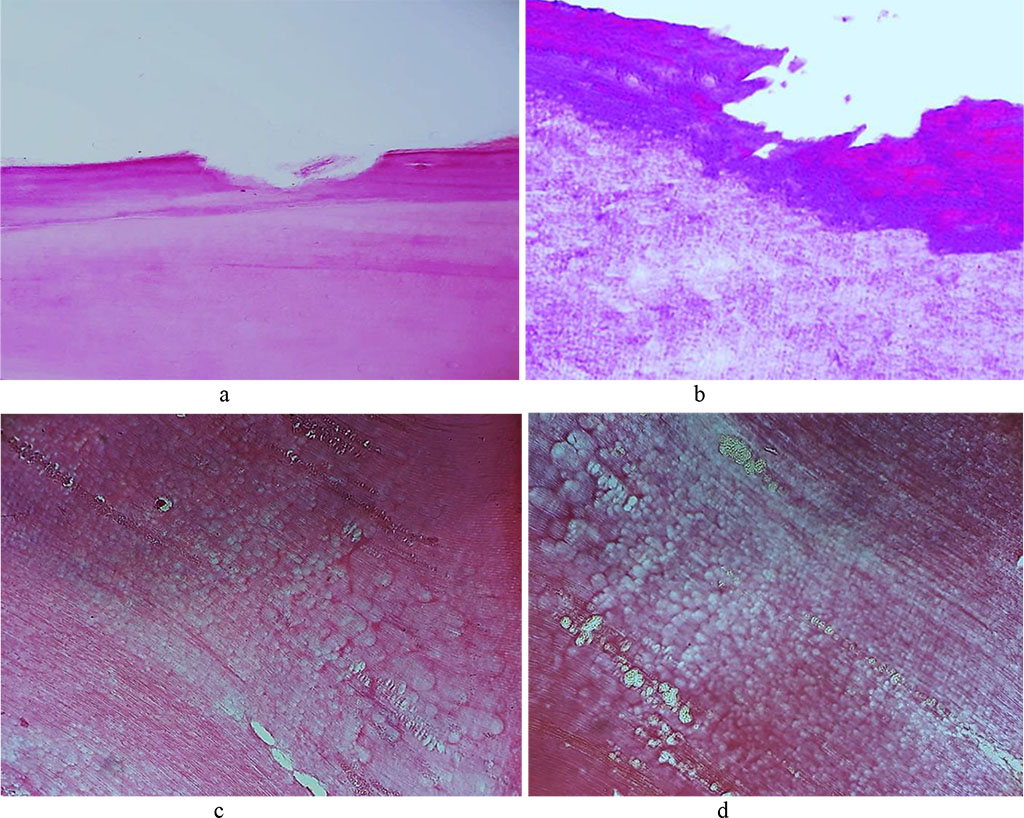
Fig. 24. Pathomorphological changes in the tooth enamel, the main group rats, Day 60 of the experiment: a – enamel surface defect manifested as erosion (×200, hematoxylin-eosin stain); b – enamel surface defect manifested as erosion (×400, hematoxylin-eosin stain); c, d – transverse striation of enamel prisms (×200, hematoxylin-eosin staining).
The population of ameloblasts showed dystrophic changes and enhanced proliferative activity of cells at the maturation stage, which, from the morphometric stance, manifests itself as an increased density of ameloblasts, if compared with the comparison group rats. Significant vacuole dystrophy and necrobiosis of ameloblasts are caused by enamel development disturbance (Fig. 25).
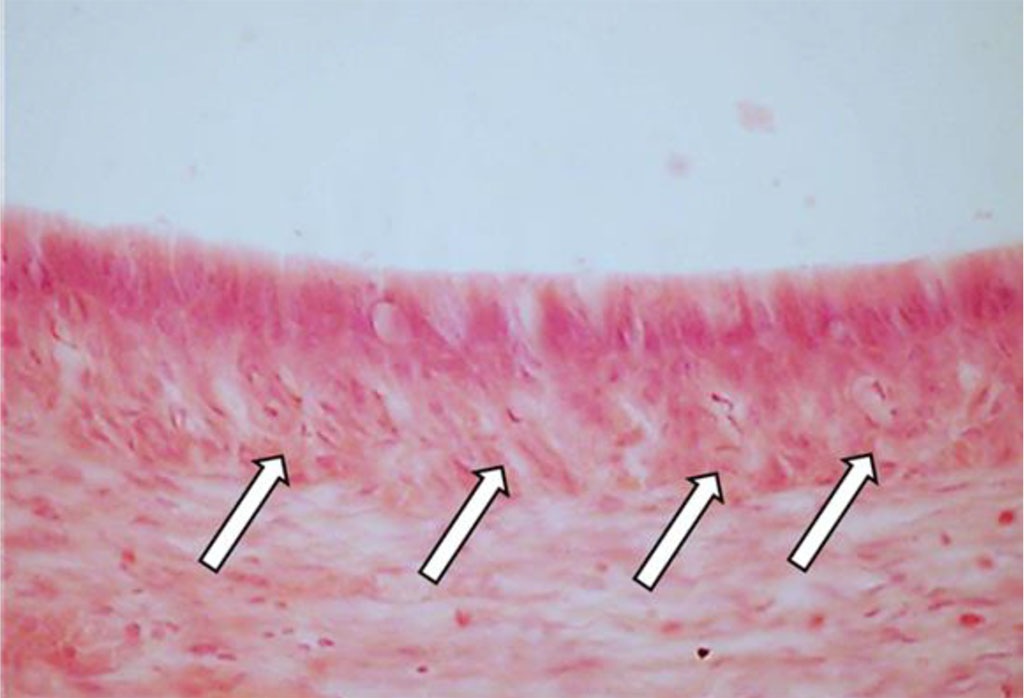
Fig. 25. Vacuole dystrophy of ameloblasts, the main group rats, Day 60 of the experiment (×800, hematoxylin-eosin staining).
Disturbance affecting the mineral metabolism and the dental enamel development features alternating thickening areas with hypocalcinosis (increased mineralization spots) and thinning foci bearing signs of hypocalcinosis (decreased mineralization spots), which manifests itself as uneven enamel thickness (Fig. 26).
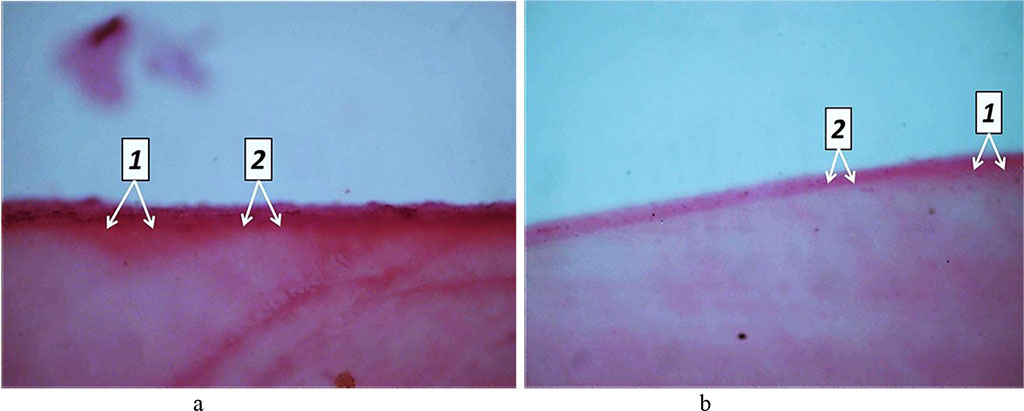
Fig. 26. Pathomorphological changes in the tooth enamel, the main group rats, Day 60 of the experiment: a, b – disturbed enamel mineralization seen as alternating zones of hypocalcinosis (1) and hypocalcinosis (2) (×100, hematoxylin-eosin staining).
Day 60 into the experiment, the dentin showed signs of processes like dystrophy, atrophy and deformation of odontoblasts, while a significant part of the odontoblasts suffered destruction. There was an accumulation of large volumes of edematous fluid, both between the odontoblasts and beneath. The resulting replacement dentin has low mineralization, while located on edge between the dentin and the pulp. Replacement dentin is located focally, while its structure shows a disorderly arranged dentin tubules, which are missing in some areas. In dentin, the signs of unbalanced mineralization manifest themselves as a combination of hypercalcinosis and hypocalcinosis areas, as well as expansion of the dentin layer and narrowing predentin layer. Histological studies of the main group rats (Day 60 of the experiment) were supported by the results of tooth tissue morphometry, which point at a statistically significant reduction in the predentin width and an increase in the width of the dentin, if compared with the respective indicators for the comparison group rats (p<0.05) (Fig. 27).
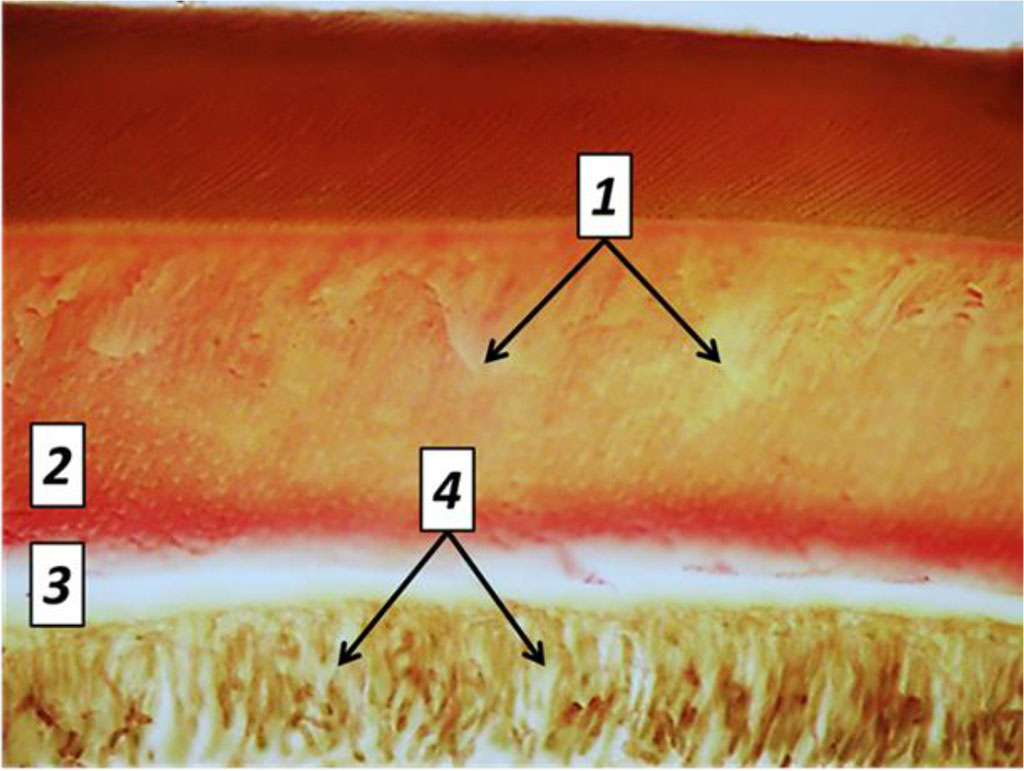
Fig. 27. Pathomorphological changes in the dental tissues, the main group rats, Day 60 of the experiment: 1– large foci of dentin demineralization; 2 – expansion of the predentin layer; 3 – accumulation of edematous fluid under the odontoblast layer; 4 – dystrophic changes of odontoblasts; (×800, Van Gieson picrofuxin staining).
By Day 60 of the experiment, the cement featured an increase in cell-free zones, while there was an increase in the cementolysis with many cavities developing. Due to lysis and resorption processes, there are bright foci appearing in the tooth cement, as well as significant dissolution (destruction) of the tooth cement could be observed. The cementocytes revealed an increase in dystrophic changes (Fig. 28).
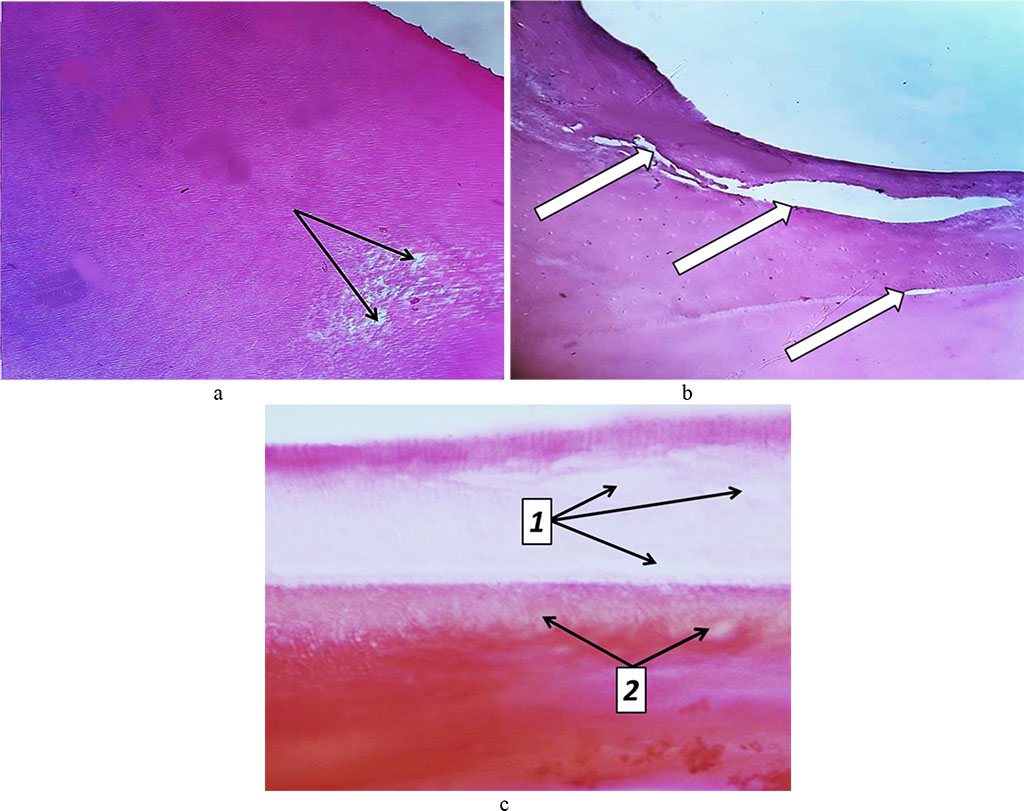
Fig. 28. Pathomorphological changes in tooth cement, the main group rats, Day 32 into the experiment: a – foci of tooth cement resorption (bright areas) (×200, hematoxylin-eosin staining); b – cavities in the tooth cement (×200, hematoxylin-eosin staining); c – foci of dental dentin resorption (1) and cement resorption (2) (×800, hematoxylin-eosin staining).
By 60 days into the experiment, severe reactive changes develop in the pulp: vascular fullness, stasis, diapedetic hemorrhages, significant edema, inflammatory infiltration, thickening of argyrophilic fibers, increased number of collagen fibers, dystrophic and destructive changes, as well as small cysts developing. Edematous fluid accumulates between fibrous structures, while collagen fibers are compressed by edematous fluid, suffer atrophy and are thinned (Fig. 29).

Fig. 29. Accumulation of edematous fluid between collagen fibers in the tooth pulp, the main group rats, Day 60 of the experiment (×800, Van Gieson picrofuxin staining).
There is atrophy of cell elements going on. The dental pulp develops cavities There is an accumulation of glycosaminoglycans. Odontoblasts suffer dystrophic changes in terms of the vacuole dystrophy, deformation and atrophy, while their number decreases (Fig. 30).

Fig. 30. Pathomorphological changes in the tooth pulp, the main group rats, Day 60 of the experiment: 1 – thinning and atrophy of collagen fibers due to compression by edematous fluid; 2 – accumulation of edematous fluid between collagen fibers with cavities developing (×200, hematoxylin–eosin staining).
The results of morphometric values of the dental tissues in the main group rats on Day 60 of the experiment show that the enamel thickness is 18.19±1.36 microns, the thickness of dentin is 105.11±3.16 microns, the thickness of predentin is 20.93±1.16 microns, the thickness of cement is 31.04±1.46 microns, the thickness of pulp is 120.38±5.26 microns, the diameter of dentin tubules is 1.56±0.13 microns, the odontoblast density is 7312.61±256.19 units/mm2, while the ameloblast density is 6849.06±253.84 units/mm2.

|
||