- Home
- About the Journal
- Peer Review
- Editorial Board
- For Authors
- Reviewer Recognition
- Archive
- Contact
- Impressum
- EWG e.V.
Cite as: Archiv EuroMedica. 2024. 14; 3. DOI 10.35630/2024/14/3.333
The aim of the research was to study the age characteristics of area and volume of the hypophyseal fossa, which, in our opinion, are important for clinical practice. It is known that any noticeable changes in the dimensions of the hypophyseal fossa, including its volume, disrup functioning of the pituitary gland. Changes in the shape of the pituitary gland are associated with a number of congenital diseases (Down syndrome, Sekel syndrome, Williams syndrome and Aksenfeld-Rieger syndrome).
Material and methods: The research consisted of 86 tomograms taken from the archives in Department of Radiation Diagnostics and Therapy, Department of Radiology of the Educational Surgery Clinic of Azerbaijan Medical University. When selecting in a retrospective review, skulls with morphological changes of the cranial bones and visible facial bones were identified. The material was divided into 4 age groups: I group (7-12 years old), II group (13-21 years old), III group (22-61 years old), IV group (62 years old and older). To measure the area of the hypophyseal fossa, we determined the distance between the middle (a) and posterior (b) clinoid processes, the length (h) and depth (l) between these lines. Taking into account that the hypophyseal fossa is trapezoidal in the vertical norm (norma verticalis), we calculated its area S= xh and its volume V xhxl using the formulas. The obtained results were recorded and statistical analysis was carried out. Researches were carried out in 128-slice TOSHIBA tomograph. Measurements were made in axial and sagittal projections using RadiAnt DICOM Viewer program adapted for computer use. When analyzing indicators by variation groups, the mean score (M), standard error (±m), 95% confidence interval (95% CI), average structure - Me (median), quartiles (Q1, Q3), minimal and maximal (min, max) indicators were calculated. The difference between groups was assessed by ANNOVA (t-test). When comparing two or more groups, the results were performed with the non-parametric H-Kruskal-Wallis test.
Results:When comparing all age groups, high difference integrity is observed in both area and volume indicators . These indicators are minimal in I age group. Changes in volume indicators also showed the same dynamics: this indicator was 576.3±38.2 mm 3 (min-max - 414.0-947.0) in the I age group, 686.4±35.4 mm 3 (min -max - 513.0) in the II age group, 758.9±35.3 mm 3 (min-max - 401.0-1251.0) in the III age group and 817.8±36.7 mm 3 (min-max - 493.0-978.0) in the IV age group.
Keywords: Hypophyseal fossa, area and volume indicator, bones of the skull
The analysis of recent scientific literature shows an increased interest in cephalometry, including the sphenoid bone, located in the center of the base of skull (in the middle cranial fossa), and some structures on its upper surface - the sella turcica and the hypophyseal fossa, due to the development of modern medical research methods (X-ray diagnostics) [1,2,3,4]. The sella turcica is an important part of the neurocranium and the craniofacial complex, and forms a bony bed (hypophyseal fossa) for the pituitary gland, one of the main glands of the endocrine system [5]. Researchers have determined that any noticeable changes in the dimensions of the hypophyseal fossa, including its volume, can cause a disruption of the functions of the pituitary gland; on the other hand, severe pathology (tumors) of this gland affects the morphology of the hypophyseal fossa, Changes in the shape of the pituitary gland are associated with a number of congenital diseases (Down syndrome, Sekel syndrome, Williams syndrome and Aksenfeld-Rieger syndrome). [6,7].
It should be noted that despite the existence of a number of studies on the age characteristics of the morphometric indicators of the sella turcica, including the hypophyseal fossa (2,8), we have found that there are different opinions on the solution of this problem in the scientific literature we have obtained.
For this reason, the purpose of our research was to study the age characteristics of area and volume of the hypophyseal fossa, which, in our opinion, are important for clinical practice.
The study consisted of tomograms of 86 Azerbaijani population taken from the archive in Department of Radiation Diagnostics and Therapy, Department of Radiology of the Educational Surgery Clinic of Azerbaijan Medical University. When selecting in a retrospective review, skulls with morphological changes of the cranial bones and visible facial bones were identified. The material was divided into 4 age groups: I group (7-12 years old), II group (13-21 years old), III group (22-61 years old), IV group (62 years old and older). The number for each age group is given in the diagram below (Diagram 1).
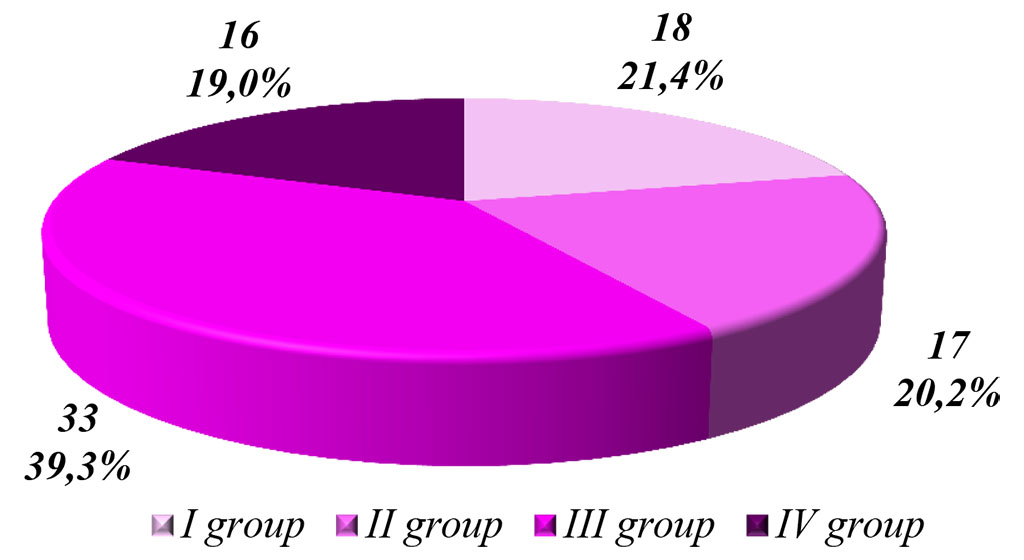
Diagram 1. Distribution of the research object by age groups.
To measure the area of the hypophyseal fossa, we determined the distance between the middle (a) and posterior (b) clinoid processes, the length (h) and depth (l) between these lines (Fig. 1, Fig. 2). Taking into account that the hypophyseal fossa is trapezoidal in the vertical norm (norma verticalis), we calculated its area S= xh and its volume V xhxl using the formulas [8,9]. The obtained results were recorded and statistical analysis was carried out. Researches were carried out in 128-slice TOSHIBA tomograph. Measurements were made in axial and sagittal projections using RadiAnt DICOM Viewer program adapted for computer use. When analyzing indicators by variation groups, the mean score (M), standard error (±m), 95% confidence interval (95% CI), average structure - Me (median), quartiles (Q1, Q3), minimal and maximal (min, max) indicators were calculated. The difference between groups was assessed by ANNOVA (t-test). When comparing two or more groups, the results were performed with the non-parametric H-Kruskal-Wallis test. "0" hypothesis was rejected with statistical significance p < 0.050 (10).
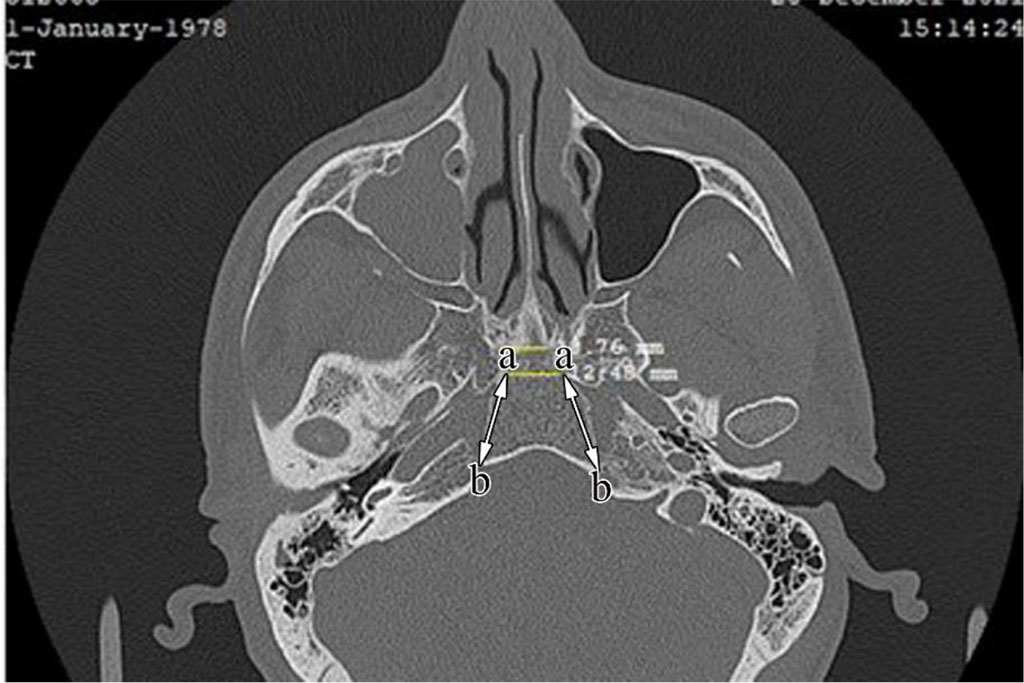
Fig. 1. The distance between the middle (a) and posterior (b) clinoid processes in axial projection, in a 45-year-old man.
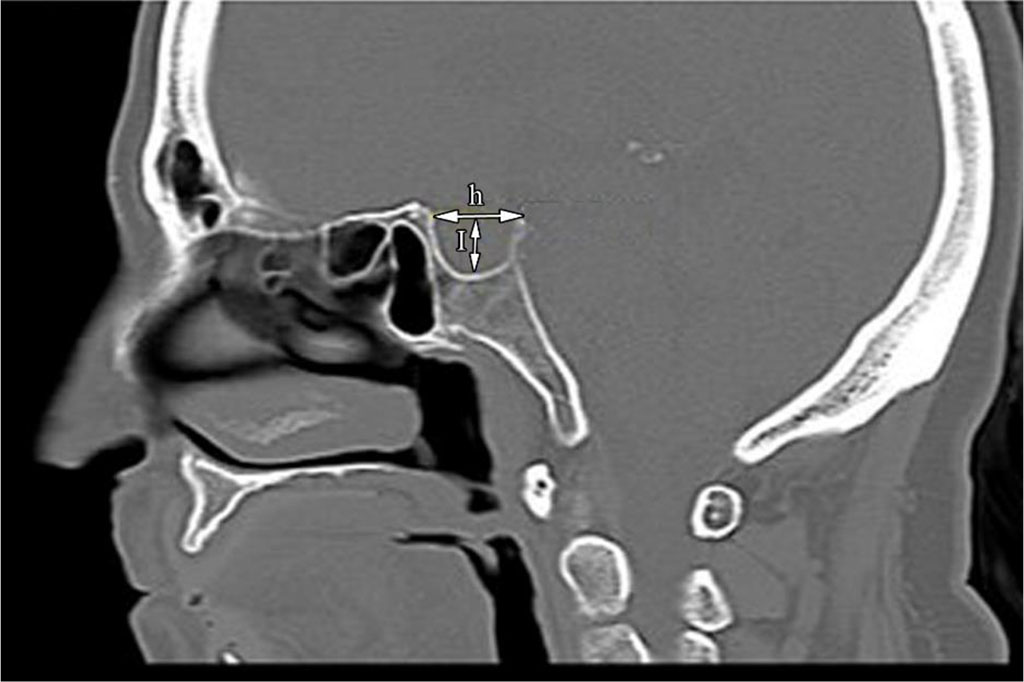
Fig. 2. The length (h) and depth (I) indicators in a sagittal projection, in a 26-year-old woman
The results of our research are reflected in the graph below (Graph 1). During the comparison of all age groups, high difference integrity is observed in both area (P ˂0.001) and volume (P ˂0.001) indicators. These indicators are minimal in I age group. Thus, the area of the hypophyseal fossa in this age group is 75.8±2.3 mm2 (min-max - 56.7-99.4; 95% CI), and it increases in II (89.7±4.2 mm2, min-max - 60.8-113.0; 95% CI), III (92, 0±3.1 mm2, min-max - 59.7-124.8; 95% CI) and IV (100.3±3.2 mm2 , min-max - 74.6-113.7; 95% CI) age groups. In the I age group the lower quartile (Me=74.2; Q1-Q3=73.0-79.7), in the IV age group the upper quartile (Me=106.0; Q1-Q3=91.5-110.6) is close to the median location was determined.
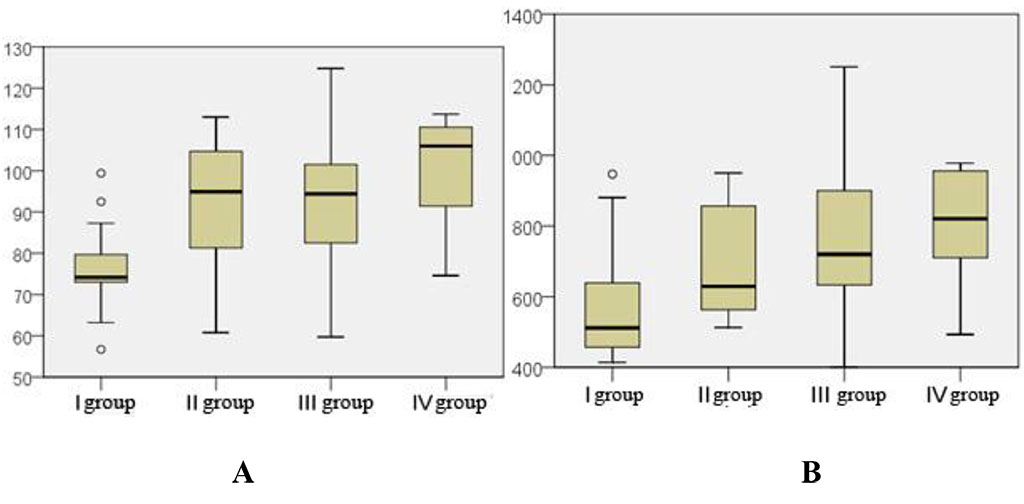
Graph 1. Statistical analysis of the area (A) and volume (B) of the hypophyseal fossa
Changes in volume indicators also showed the same dynamics: this indicator was 576.3±38.2 mm3 (min-max - 414.0-947.0; 95% ) in the I age group, 686.4±35.4 mm3 (min-max - 513.0-950.0; 95% CI in the II age group, 758.9±35.3 mm3 (min-max - 401.0-1251.0; 95% CI) in the III age group and 817, 8±36.7 mm3 (min-max - 493.0-978.0; 95% CI) in the IV age group. As can be seen from the graph, the density of quartiles in relation to the median is less noticeable.
The results of the t-test revealed a significant difference between the area and volume indicators of the I age group compared to the III (area and volume - P=0.004) and IV (area - P ˂0.001; volume - P=0.001) age groups.
The indicators obtained as a result of the study are agree with the results of other authors. Thus, Hasan H.A., et al. [7], in the computer-tomogram sections (lateral cephalogram) of 71 people, noted that a number of morphometric indicators, including the area of the hypophyseal fossa, increased with age. The authors suggest that this dynamic is mainly completed during puberty, and the results were obtained from two age groups (9-14 and 15-26). Such an opinion was also voiced by other authors [2,4]. However, our results show that this dynamic covers all age groups and shows a difference not only in the 13-21 age group, but also in the 22-61 and older age group compared to the 7-12 age group. Abebe G., et al., [12]. found that the parameters of the hypophyseal fossa increase above the age of 30 years. Measurements of volume of hypophyseal fossa also revealed the same dynamics with age. Our obtained data are close to those obtained by other authors [13]. But Pecina H.I., et al. [14] received larger numbers (in men - 1111.14 mm3, in women - 1354.42 mm3). We can explain this by the fact that these authors define the anterior border of the hypophyseal fossa along the line passing through the tuberculum sellae. And we measure the border of the hypophyseal fossa based on the line between the clinoid processes [6].
As a result of the measurements carried out in separate age groups, we found that the area and volume of the hypophyseal fossa increased from the age of 7 years to the age of 62 years and older, and the results obtained had high differential accuracy. These indicators can also be used in clinical practice to evaluate the hypophyseal fossa at different ages in norm and different pathologies.

|
||