- Home
- About the Journal
- Peer Review
- Editorial Board
- For Authors
- Reviewer Recognition
- Archive
- Contact
- Impressum
- EWG e.V.
Cite as: Archiv EuroMedica. 2022. 12; 3: e1. DOI 10.35630/2199-885X/2022/12/3.8
The aim of the study was to develop a prematurity score model for predicting morbidity in premature infants in the neonatal period.
Material and methods. To build an analytical model, such parameter as gestational age is used, measured in weeks with the range of changes in the score between 0 to 10, where a score of 38 - 40 weeks should correspond to 0 points, i.e., at this gestational age, the morbidity rate due to morphological immaturity of organs and systems is minimal, because by this gestational age the organ development is almost completed. The maximum score is 9.9, at gestational age of 22 weeks, which is associated with severe morphological immaturity and, therefore, high morbidity in a premature infant.
Results. Based on mathematical calculations, we built a model of prematurity score, which helps estimate the degree of abnormality of a premature baby depending on gestational age. The lower it is, the higher is the score of prematurity and the likelihood of morbidity due to morphological immaturity of organs and systems.
Conclusion. The proposed analytical model of prematurity score can be used to uniformly assess the prematurity factor in order to further determine the medical strategy. The model can be effectively used in scientific research and to identify statistically necessary relationships in a wide variety of studies. The main value of the model lies not in obtaining specific numerical values, but in the suggested analytical relationship reflecting the degree of morphological maturity and allowing probability estimation of the newborn morbidity.
Keywords: prematurity score; newborn; morbidity; mortality; prenatal morphogenesis
High quality specialized medical care for newborns with respiratory and circulatory disorders in the early neonatal period is a key issue of anesthesiology and critical care medicine. An increasing number of children need critical care starting from birth, so the researchers continue seeking early recognition and prediction tools for the development, progression and outcome of critical illness in newborns.
The scales that can help make a prompt diagnosis in a specific clinical situation are the most convenient and easy to use. Perinatal hypoxia and asphyxia of the newborn are among the most clinically important conditions requiring a quick diagnosis. In 1952, at the XXVII International Congress of Anesthesiologists, an American physician Virginia Apgar presented the first system for rapid assessment of hypoxia severity in a newborn, which was later called the Apgar Scale [1]. For many decades, it has been used worldwide to assess each newborn baby, which has reduced the mortality rate of babies born in acute asphyxia, improving immediate and long-term outcomes. The search for causes and early diagnosis of hypoxia is one of the primary tasks that should be addressed at birth, since hypoxia and its sequelae can result in the death of a newborn, or, if the child survives, in impaired neuropsychological development [2].
Initially, the Apgar scale was intended for full-term infants, but decades later, it became obvious that the scale is not applicable to a specific population, which includes premature and extremely premature infants, due to incomplete development of their nervous and respiratory systems. Therefore, to assess the severity of acute respiratory failure in premature infants with respiratory distress syndrome (RDSN), an appropriate scale was developed in 1956 by American pediatricians William Silverman and Dorothy Andersen. The scale includes the following characteristics: upper chest movement, lower chest (intercostal) retractions, xiphoid retractions, mandibular position, and respiratory pattern. The assessment is performed immediately at birth and after 2, 6, 12 and 24 hours. It is used to establish indications for respiratory therapy and assess its effectiveness [3].
One of the most promising tools for neonatal disease severity assessment is a revised version of the Score for Neonatal Acute Physiology (SNAP-II), which assesses the instability of the child's physiological parameters not only in the first day of life, but also throughout the neonatal period [4,5]. The disease severity is associated with the lethal outcome likelihood, but the scale includes numerous parameters, which makes it not always applicable.
The scales should use the patient history and clinical presentation to accurately assess the risk of lethal outcome. The neonatal assessment scales commonly used in clinical practice do not always allow the neonatal prognosis to be determined. The SNAP (Score for Neonatal Acute Physiology) and CRIB (Clinical Risk Index for Babies) assessment systems are used to assess the severity of prematurity. They are tools for comparative assessment of the risk of adverse outcomes [6,7]. Current scales are divided into two large groups:
predictive ones including PRISM (Pediatric Risk of Mortality), PIM (Pediatric Index of Mortality), CRIB, SNAP
scales of current assessment such as PEMOD (Pediatric Multiple Organ Dysfunction Score), PELOD (Pediatric Logistic Organ Dysfunction Score), NEOMOD (Neonatal Multiple Organ Dysfunction Score) [6,7,8].
NEOMOD is the only neonatal organ dysfunction scale that has been obtained on a fairly significant sample of premature infants. It was created in a prospective study of 142 extremely low birth weight infants over a period of 28 days after birth.
Modern computer technology can perform automatic calculations to assess the severity of the disease and determine the possible risks to the child, which can help clinicians in choosing treatment strategy [6].
Advances in perinatal medicine have improved the morbidity and mortality of premature infants [9,10], but gestational age at birth is considered to be one of the main predictors of neonatal mortality. There is a direct correlation between them: the shorter the gestational age, the higher the neonatal mortality. The mortality rate in a very premature infant with extremely low birth weight (ELBW) can be ten times higher than in a full-term infant [11]. Gestational age reflects the degree of morphological maturation of fetal organs at the time of birth, and the morphological immaturity of the central nervous system is a key problem of premature infants, because it is the most sensitive to hypoxia, metabolic disorders and other adverse events occurring in the perinatal period [12,13,14].
A unified methodology for assessing the degree of prematurity or prematurity score is necessary both to determine the management of the newborn and to obtain more accurate results in scientific research.
The aim of the study was to develop a prematurity score model for predicting the morbidity of a premature infant in the neonatal period.
The prematurity score is a tool that can be used to more accurately estimate the probability of morbidity in a premature infant. The parameter used to build the analytical model is gestational age, measured in weeks, and the range of this parameter values is between 0 and 10.
The prematurity score should change gradually with gestational age. The stepwise, i.e., chart-based estimation of the score is both less accurate and, in certain situations, inconsistent: it is not clear which value should be chosen if gestational age coincides with the range limit. It is also clear that the task has a probabilistic nature, i.e., we cannot determine the exact cut-off value below which the infant becomes nonviable. Therefore, it is more logical to assume that around the supposed limit the score should asymptotically tend to absolutely “negative" values, but never reach them.
The prematurity score will assess the infant morbidity. Thus, the term of 38 - 40 weeks should correspond to a score of 0, i.e., at this gestational age morbidity is minimal, because by this gestational age the organ development is almost complete. With decreasing gestational age, the score will tend to 10, and the smaller the gestational age of the child, the higher the score of prematurity will be. Expert estimates should be taken as "reference" values for the formulation of the analytical relationship.
Based on the problem statement, the desired graph should have approximately the following form (Fig. 1).
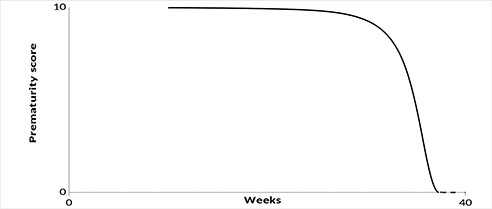
Figure 1. Graphic representation of relationship between prematurity score and age of gestation.
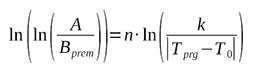
This relationship should be calculated according to the following formula:
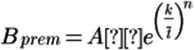 (1)
(1)
Where Bprem - the prematurity score,
A = 10 (scaling factor);
k – timescale factor;
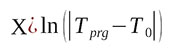
![]() =
= ![]() – absolute value of gestational age variation from the ideal
value;
– absolute value of gestational age variation from the ideal
value;
![]() – gestational
age;
– gestational
age;
![]() – ideal
gestational age;
– ideal
gestational age;
n – slope of the curve.
There are two unknown coefficients k and n in the proposed formula (1), which we will seek based on specified expert values.
Let us take the following expert values as "reference" values (Table 2).
Table 2. Expert values.
| Tprg | Bprem |
| 22 | 9.9 |
| 36 | 2 |
| 38 | 0.000001 |
| 40 | 0 |
When Tprg = 38, the expert value of Bprem = 0 in the table is replaced by Bprem = 0.000001, because no two values can be the same when describing a monotonic curve of the prematurity score. This replacement does not bring any additional errors, in terms of the required accuracy.
Using the "reference" expert values from Table 2, we find the coefficients k and n (1). For this purpose, we take the logarithm of the expression (1) by first dividing both parts by A and substituting the expression for t ̅,
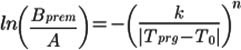 (2)
(2)
We will flip the fraction under the logarithm on the left side and reverse the sign on the right side accordingly
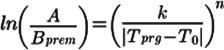 (3)
(3)
Then we will take the logarithm of the expression (3) again to get rid of the n exponent
 (4)
(4)
On the right hand side, let's express the logarithm of the fraction as the difference of the logarithms
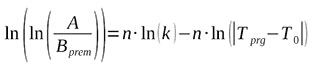 (5)
(5)
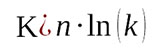
Let us introduce the notations:
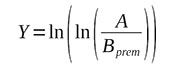 (6)
(6)
 (7)
(7)
 (8)
(8)
Then equation (5) will have a form of
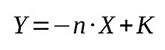 (9)
(9)
Based on table 2 and expressions (6)-(9), let's construct table 3 to determine the n and K coefficients of linear regression (9). The point (40; 0) according to expressions (8) and (9) is converted to (-∞; -∞), so it should be excluded from the data for plotting the regression Y(X).
Table 3. Baseline data for the construction of linear regressions
| X | Y | ||
| 22 | 9.9 | 2.890371758 | -4.600149 |
| 36 | 2 | 1.386294361 | 0.475885 |
| 38 | 0.000001 | 0.693147181 | 2.7799426 |
| 40 | 0 | - | - |
Based on the data in Table 3, let us plot a linear regression Y(X) (Fig.2)
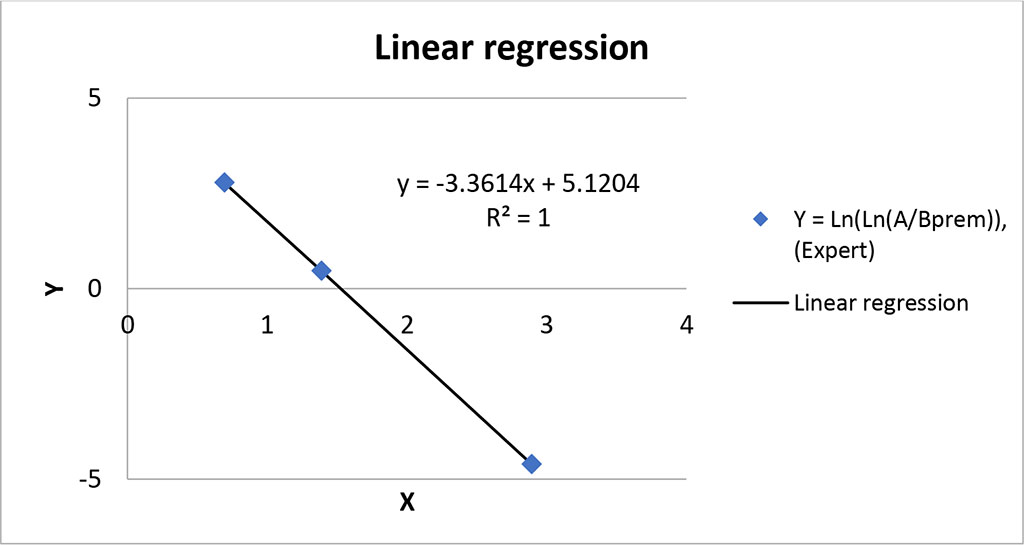
Figure 2. Linear regression Y(X).
As one can see from the graph, the linear regression calculated using the method of least squares passes through the given points perfectly (correlation coefficient R=1). The graph also shows the equation and, respectively, the regression coefficients:
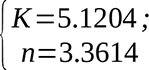 (10)
(10)
From formula (7) we can obtain the coefficient k to use it in (1)
 (11)
(11)
Then K=4.587
And the resulting graph of the Prematurity Score model takes the following form (Figs. 3,4).
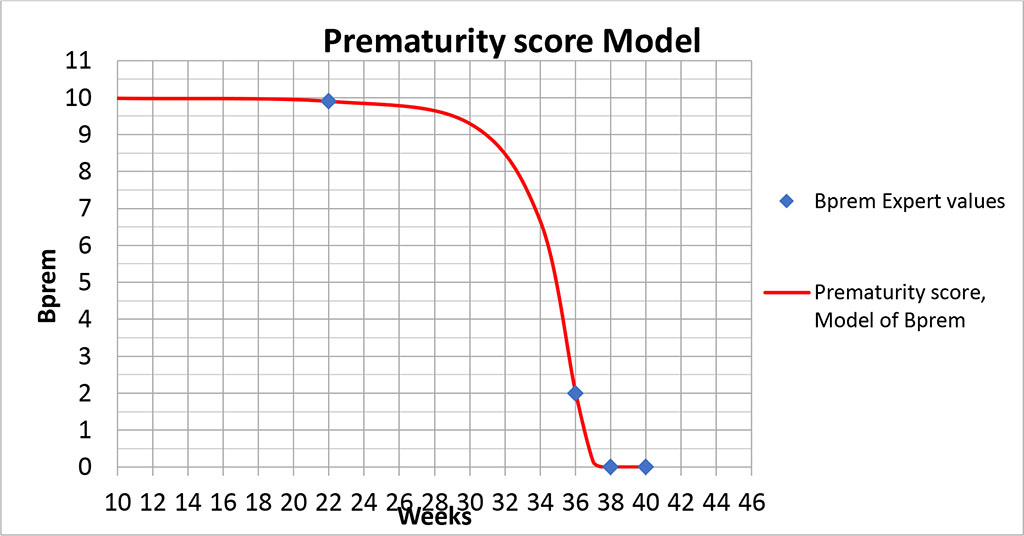
Figure 3. Graph of the prematurity score model.
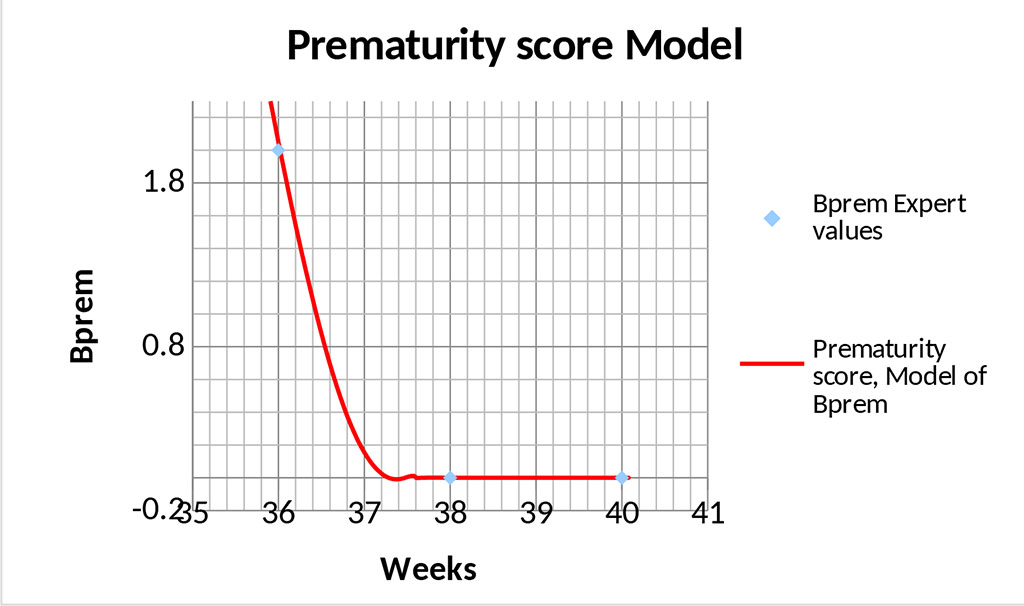
Figure 4. Graph of the prematurity score model – area of optimal values.
The graphs (Figs. 3,4) show that the proposed model " seamlessly" describes the entire range of possible values. The point (40; 0) is special because formula (1) will yield uncertainty at this point, since this point does not fall within the area of definition of this formula. However, calculating the limit from dependence (1) at Tprg →0 gives the correct value.
In the presented model, the gestational age of 22 - 25 weeks corresponds to 9.9-9.8 points, which represents almost maximum value and critical morbidity of the newborn. Indeed, this gestational age is associated with severe morphological immaturity of the child. The main problems of children born at this gestational age are morphological immaturity and antenatal lung damage, which greatly increase the risk of acute respiratory failure (ARF) due to lung hypoxia and ischemia, surfactant deficiency and other factors [15]. Lung development at 22-26 weeks of gestation corresponds to the canalicular period associated with formation of primitive acini and differentiation of alveolar cells with initial stages of surfactant and fetal lung fluid development [16], i.e., there are still no so-called "alveolar sacs" and alveoli, no full-grown 2nd order alveolar cells producing surfactant, and full gas exchange function of the lungs immediately after birth is not possible. The terminal sac period of lung development begins at 26 weeks of gestation, when alveolar passages are formed, alveolar sacs and primitive alveoli appear. In most cases of extremely low birth weight newborns, the lung has canalicular structure. Parenchyma is represented by numerous alveolar ducts lined by cuboidal epithelium and enclosed by undifferentiated connective tissue. Wide primitive vessels are filled with blood, and capillary network of the lung is underdeveloped. In some children the lung has alveolar structure, but alveolar septa are wide, many alveoli are lined by cuboidal epithelium [17].
At 31-33 weeks of gestation lung development proceeds, which ensures its functional adequacy and reduces the risk of morbidity of premature infants born in this gestational period. The number of alveoli in the lungs significantly increases, the alveolar wall becomes thinner, collagen structures appear in alveolar passages, septa are covered with flattened epithelium and contain a dense network of capillaries, the production of surfactant increases, which enhances the functional capacity of lungs and the risk of neonatal morbidity begins to decrease. This gestational age corresponds to a 9 points in the prematurity model. By gestational age of 34-35 weeks, differences in the structure of the lung parenchyma between the superficial and deep regions appear. The acinar development progresses [18].
Premature birth and hypoxemia that a premature infant may experience adversely affect the developmental trajectory of all brain structures [19]. Cerebral blood flow autoregulation disorders with the underlying profound prematurity are associated with low cerebral blood flow or its significant fluctuations, especially with unstable central hemodynamics, which leads to worsening cerebral ischemia or hemorrhage [20]. Ligation of a hemodynamically significant open arterial duct in grade I-II intraventricular hemorrhage increases the risk of cerebral malformations, because intra- and postoperative alteration of central hemodynamics affects cerebral blood flow, which may contribute to further damage of brain structures [21].
Zhang et al., Christian et al. showed that the most common grade III-IV hemorrhages occurring in children with gestational age of less than 28 weeks are the ones in germinal matrix and vascular plexus. These hemorrhages result in cystic periventricular leukomalacia and posthemorrhagic hydrocephalus [22,23]. The source of subependymal and intraventricular hemorrhages is the germinal matrix, which is the fetal tissue characteristic of fetuses at 22 to 32 weeks’ gestation, corresponding to 9.8-8 points of the Prematurity Model, that is, children born in this period have the risk of developing the complications listed above. Physiological reduction of the germinal matrix begins at 32 weeks and ends by full-term gestation [24,25]. This gestational age is associated with a progressive decrease in the model score of prematurity, while the probability of premature infant morbidity declines.
Gestational age of 22 to 26 weeks is associated with a high probability of death. Gestational age of 22 weeks corresponds to 9.9 points in the model of prematurity score. A decrease of 1 point occurs only after 9 weeks and reaches 9 points by 31 weeks’ gestation. After this age, there is a rapid decrease in the prematurity score. Thus, between 31 and 33 weeks, it decreases by another 1 point. Further, with increasing gestational age, the prematurity score progressively decreases, tending to 0 at full-term gestation, when the main morphogenesis of a full-term pregnancy is completed.
The proposed analytical model of prematurity score can be used for a consistent assessment of the prematurity factor to determine the medical management strategy. The model can be effectively used in scientific research and identification of necessary statistical relationships in a wide variety of studies.
The main value of the model lies not in obtaining specific numerical values, but in the proposed form of analytical relationship. The model represents the degree of morphological maturity and allows to estimate the probability of abnormalities in the newborn.
The authors declare no conflict of interest.

|
||