- Home
- About the Journal
- Peer Review
- Editorial Board
- For Authors
- Reviewer Recognition
- Archive
- Contact
- Impressum
- EWG e.V.
Prototype models of intra-arterial circulation is one of the priority aims of experimental cardiology, as well as for the study of atherosclerosis.
Purpose: To study the features of intra-arterial hemodynamics in the area of atheroma of the artery in physical modeling.
Materials and methods: We used an original "Device for modeling intra-arterial circulation". The main parts of the model: glass rotameter tube in the form of a truncated cylinder, inlet and outlet ends of which are fixed with elastic plastic tubes connected to an electric water pump immersed in a container with glycerol solution. Inside the rotameter, using a fitting from the inlet, it is possible to install a pressure sensor that transfers data to the oscilloscope; indicators - a silk thread or dye - ink. The variable pump mode allowed us to simulate a regular heart rhythm, extrasystole (ES) and atrial fibrillation (AF).
Results: In the first post-extrasystolic wave, a turbulent fluid flow formed after the plaque, standing waves and waves reflected from the walls of the rotameter were observed; the sensor registered an increase in pressure 1,6 times more compared with a regular heart rate wave. The marginal plaque zones along and against the fluid flow, especially the areas bordering the intact part of the arterial vessel, underwent the main mechanical impact. The same patterns were observed in AF with a maximum duration of a pause between pulse waves of ≥1,5 s.
Conclusions: Heart arrhythmias play an important role in the intra-arterial hemodynamics changes and are the part of the pathophysiological changes in the arteries in atherosclerosis. The main danger is not the ES itself, but by the first post-extrasystolic contraction or the first pulse wave after a long pause between ventricular contractions in AF.
Keywords: atherosclerosis progression, modeling of atheroma, pathogenesis of atherosclerosis.
Nowadays, like a century ago, atherosclerosis remains one of the most unsolved problems of the world cardiology. This pathology is still the leading cause of mortality in the most of the countries. Millions of people die from the complications associated with atherosclerosis of arteries in different localizations [1-3]. At the same time, new methods of prevention and treatment are being developed; new strategies have emerged, both for drug and non-drug correction [3, 4]. Recent studies are mostly focused on biomarkers or genetic markers associated with this pathology in order to identify the risk factors, to determine the new ones and, ultimately, to reduce its incidence. Ambitious tasks are to monitor patients and prevent atherosclerosis, to identify it the signs of this pathology as soon as possible, and to prevent the development of complications dedicated to atherosclerotic process, which should lead to a decrease in mortality and an increase in the duration and quality of life. However, despite all efforts, the problem remains far from its solution.
The pathogenesis and risk factors of atherosclerosis have been studied quite thoroughly, but the refinement of pathophysiological processes and the identification of new possible relationships with other predictors are still ongoing. Mainly, the direction of cardiology science sets a vector towards the study of biomarkers. Thus, it was demonstrated the role of PCSK9, apolipoprotein B, interleukins, sortilin and other substances in the pathogenesis of atherosclerosis [2-4]. However, intra-arterial hemodynamic processes are not within the frontiers of scientific research. Mostly the investigations are based on the clinical data studies and not associated with physical modeling of some processes to confirm the revealed tendency. For obvious reasons, the study of intra-arterial hemodynamics in humans is limited mainly to non-invasive methods, such as Doppler ultrasound. Therefore, the creation of prototype models of intra-arterial circulation is one of the priority aims of experimental cardiology, also for the study of atherosclerosis [5-10]. The experiment can be the part of clinical trials, for confirmation and validation the data, in addition to the statistical methods.
Despite the fact that atherosclerosis is a systemic process, common patterns of localization of atheromas have been described by different authors: in the bifurcation area of the arteries (for example, carotid bifurcation is the typical place for the atheroma localization), a large radius of the aortic arch (commonplace for the atheromas). However, there is still no clear, unambiguous explanation for this fact. In addition, there is not general understanding why, with a long-term progressive course of atherosclerosis that can last for decades, when stenosis reaches the hemodynamic significance (70% or more in the diameter), plaque growth significantly accelerates. We believe that in order to obtain answers to these questions, it is necessary to pay attention on the study of the biophysical processes of intra-arterial hemodynamics. Studying the basis of the intra-arterial hemodynamics in different clinical situations modeling will help for the better understanding the mechanisms of atherosclerosis.
Purpose: to study the features of intra-arterial hemodynamics in the site of artery atheroma in physical modeling.
For studying of intra-arterial hemodynamics, we used an original "Device for modeling intra-arterial circulation" [11, 12]. The device in a physical model of arterial vessel created by the group of researches that included cardiologists, cardiac surgeons and engineers. The device has the closed contour and is able to simulate the blood flow in arterial vessel with all its characteristics. The model is a closed loop filled with a transparent aqueous solution of glycerol at a concentration corresponding to the viscosity of human blood. The main principal parts of the experimental model are: a glass rotameter tube in the form of a truncated cylinder 365 mm length and 20 proximal/18 mm distal parts diameters, with a thickness of the glass 2,5 mm. The inlet and outlet ends of the rotameter are attached hermetically with silicone elastic transparent tubes connected to an electric water pump immersed in a container with glycerol solution. The electric pump takes the energy from 12 Volt battery. Using the transparent parts of the device – rotameter glass tube, glycerol solution, and silicone tubes - was objective to make the necessary visualizations, measurements and perform the experiments. The construction was fixed hardly on horizontal surface (table) by the metal fixators on both sides. Behind the rotameter, we put the lamp light to make the intra-arterial processes better visualized. Inside the glass tube of the rotameter, using a fitting from the inlet, it is possible to install a pressure sensor (with piezoelectric probe) that transfers data to the oscilloscope for the recording and measuring, as well as it was possible to use the indicators - a silk thread of variable length or dye – clerical ink of contrast color (for example, black or dark blue). At the stage of preparing the experiment, for the contrast, we tried to use magnesium shavings, gas micro bubbles, but using of thread and dye appeared to be the most informative for visualizing of physical patterns when simulating an arterial vessel. The pressure sensor contained sensitive piezocrystalline with characteristics of the time 1,3, that was low-inertia. The variable electric water pump modes allowed us to simulate a regular heart rhythm, as well as extrasystoles (ES) and atrial fibrillation (AF) with different duration of pauses between pulse waves.
We realized that in an experimental physical model, it is not possible to reproduce fully a real arterial vessel, since biological tissue has unique properties. However, the use of the glass tube of the rotameter as the main part of the “Device for modeling of intra-arterial circulation” developed by us in this case was optimal and justified. This is due, first, to the fact that the tube is transparent, and when used with an aqueous solution of glycerol as a liquid imitating human blood with the same viscosity, it made it possible to perform the necessary observations and measurements. Secondly, the inlet of the rotameter was larger in diameter than the outlet, and thus, there was the imitation of the arterial vessel, when its proximal part is wider in relation to the distal one. In diameter, the rotameter tube approximately corresponds to the abdominal aorta, which on average, is about 20 mm. Thirdly, with increasing of the age, the stiffness in the arterial vessels increases, and if a patient has systemic atherosclerosis, the properties of the arteries begin to approach passive tubes, while their elastic properties are reduced. Fourthly, the use of a piezocrystalline pressure sensor allowed us to objectify pressure fluctuations inside the tube that occur in real arterial vessels in the different heart arrhythmias - ES and AF. Fifthly, the silicone tubes of the system that make up the closed circuit were elastic and had partly damping properties.
Device for modeling of intra-arterial circulation (ready for the experiments) you can see in Figure 1.
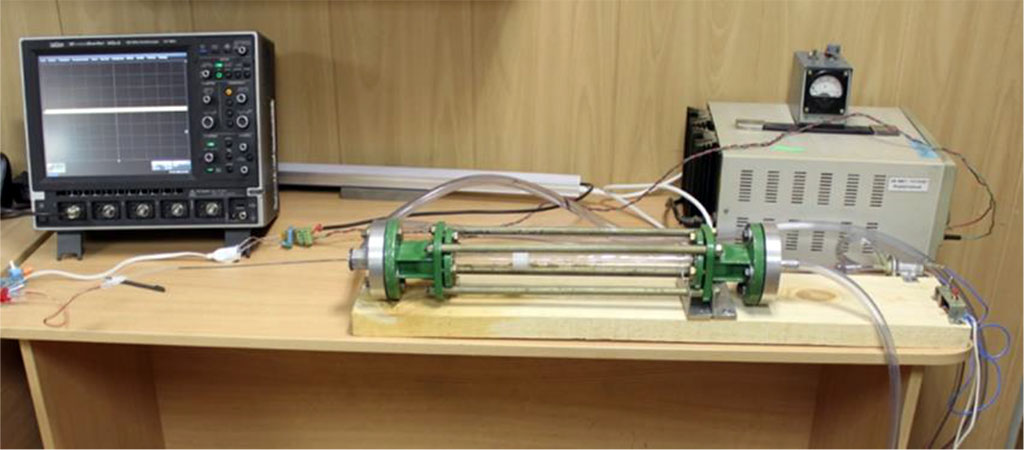
Figure 1. Device for modeling of intra-arterial circulation. Main parts: rotameter glass tube, electric water pump, oscilloscope, 12 Volt battery, silicone tubes.
A schematic representation of the model you can see in Figure 2.
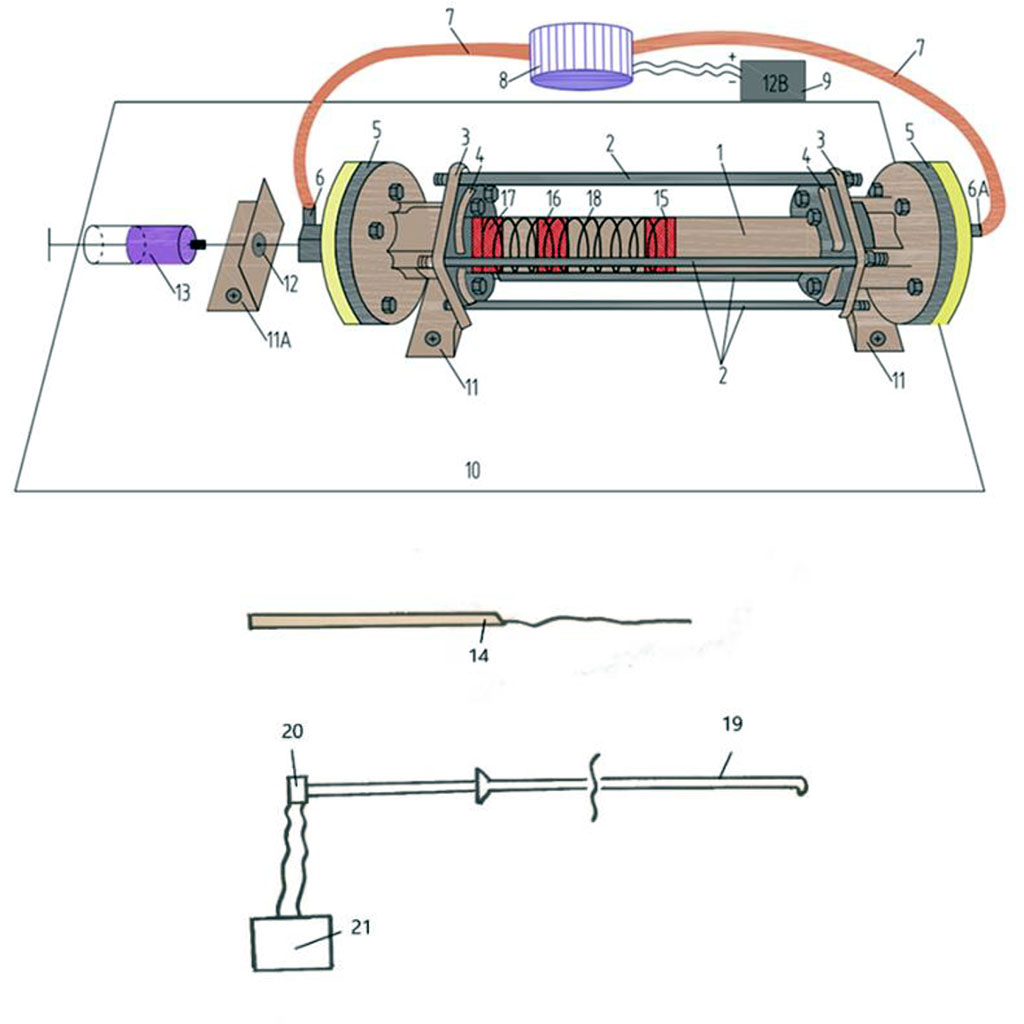
Figure 2. Schematic picture of device for modeling of intra-arterial circulation. 1 - rotameter tube 365 mm long with an inlet diameter of 20 mm, an outlet diameter of 16,5 mm and a glass thickness of 2,5 mm; 2 - four fixing steel rods 365 mm long, 1 cm in diameter, threaded on both sides, 2 cm long; 3, 4 - fixing steel couplings; 5 - steel cylinders (2 pcs.) with a diameter of 10 cm; 6 - two-way fitting with a rubber valve; 7 - silicone tubes; 8 - electric water pump; 9 - 12 Volt battery; 10 - wooden board or table; 11, 11A - steel corners (3 pcs.); 12 - hole for the needle; 13 - a syringe for the introduction of dyes (stationary ink); 14 - conductor with silk thread; 15, 16, 17 - imitation of atheromas at different points in time (liquid plastic); 18 - imitation of spiral muscle fibers of an arterial vessel; 19 - catheter (introduced inside the rotameter); 20 - piezocrystalline pressure sensor; 21 - oscilloscope.
We used a fast drying liquid plastic, fixing it on one of the internal walls of the rotameter to simulate a marginal hemodynamically insignificant plaque with a stenosis of 50% in diameter. At the initial phase of experiment, we put it in the rotameter tube before filling the contour with and aqueous glycerol solution. After the plastic atheroma got dry, we filled the rotameter all contour of the device with the solution to start the experiment.
In experiments, indicators (silk thread or dye) were inserted alternately; the pressure inside the rotameter was measured by a piezocrystalline pressure sensor, the data from which were recorded by an oscilloscope and after analyzed. The pressure sensor was installed in the proximal part of the atheroma, it was shifted to the zone of maximum narrowing, as well as to the distal part, while the pressure measurement in the above-mentioned areas was repeated. The electric water pump simulated the regular heart rhythm, ES and AF with different durations of maximum pauses between cardiac cycles.
The main parameters of the device for modeling of intra-arterial circulation with the regular heart rhythm, ES and AF see in Table 1. We repeated the measurements without and with the established atheroma 20 times each measurement.
Table 1. The main parameters of the device for modeling of intra-arterial circulation without atheroma imitation and with atheroma 50% in diameter.
| № | Atheroma in rotameter, % in diameter | Dt, mm | d, mm | St, мм2 | S, мм2 | (Sd/St)×100% | V, m/sec, M±σ |
| 1 | - | 18,19 | 18 | 259,74 | 259,74 | 100 | 1,03±0,21 |
| 2 | 50% | 18,09 | 10 | 256,89 | 122,66 | 47,75 | 2,09±0,42 |
| 3 | 50% | 18,09 | 10 | 256,89 | 122,66 | 47,75 | 4,55±0,51 |
| 4 | 50% | 18,09 | 10 | 256,89 | 122,66 | 47,75 | 4,32±0,48 |
Notes. 1 - parameters without atheroma; 2 - marginal atheroma 50% with the regular heart rhythm; 3 - marginal atheroma 50% with ES (parameters for the wave of the first post-extrasystolic contraction); 4 - marginal atheroma 50% in AF (parameters for a pulse wave after a pause of 1,5 seconds); Dt - the inner diameter of the tube in the section corresponding to the middle (along the length) of the installed atheroma; d - the diameter of the free hole; S - the cross-sectional area of the tube corresponding to the middle (along the length) of the installed atheroma; Sd is the cross-sectional area of the diaphragm opening; V - flow velocity for an ideal fluid in a hole in the atheroma area at a flow velocity in an open tube of 1 m/s.
When ES was simulated during the passage of the wave of the first post-extrasystolic contraction, a turbulent fluid flow formed after the plaque, standing waves and waves reflected from the walls of the rotameter were observed; the sensor, with multiple repetitions, registered an increase in pressure by an average of 1,6 times compared with a regular heart rate wave. At the same time, the marginal plaque zones along and against the fluid flow, especially the areas bordering the intact part of the arterial vessel, underwent the main mechanical impact. The same patterns were observed in simulating AF with a maximum duration of a pause between pulse waves of 1,5 seconds or more (Figures 3,4).
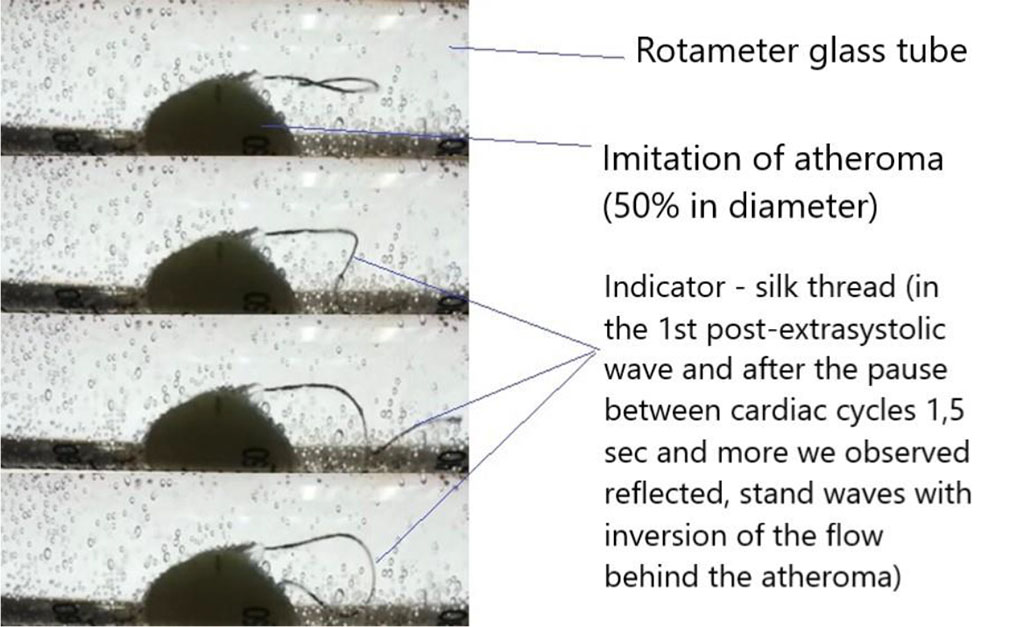
Figure 3. Application of the indicator - silk thread.
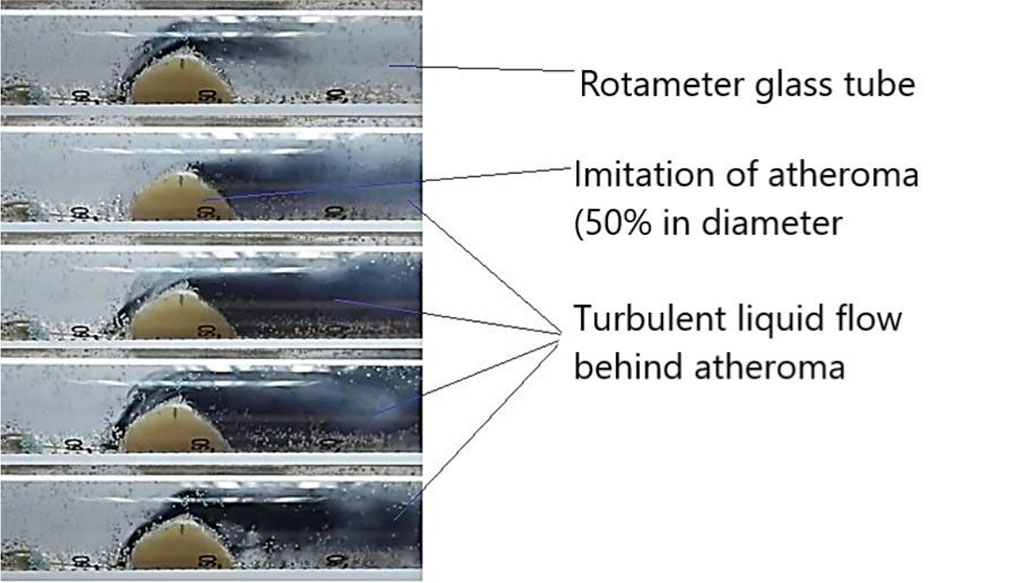
Figure 4. Application of the indicator - dye - ink.
Figure 5 demonstrates pressure data from the sensor, recorded by an oscilloscope.
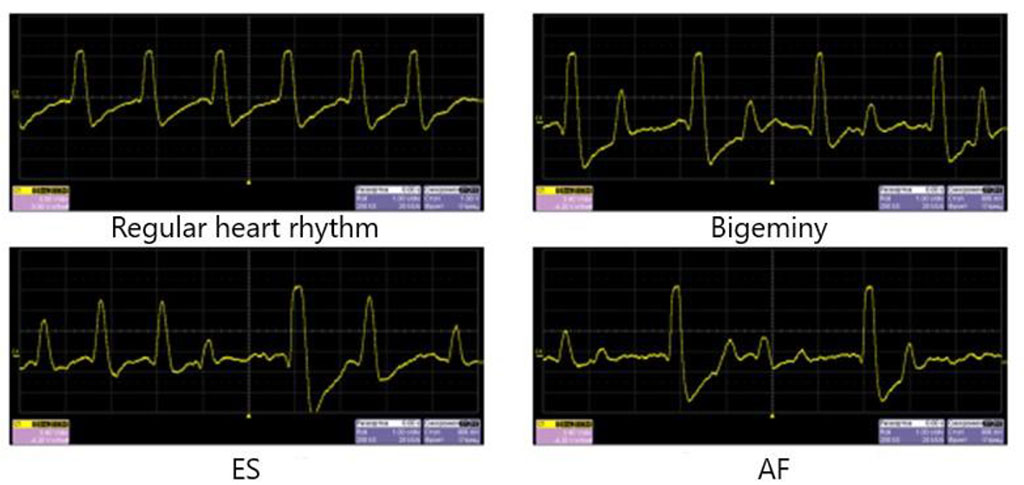
Figure 5. Pressure data for regular heart rhythm and heart arrhythmias simulation. There is an increase in pressure in the first post-extrasystolic wave and during the passage of the pulse wave after a long pause in AF.
So, in oscilloscope we could observe the rising of the pressure in the rotameter tube in the spreading of the first post-extrasystolic wave and in the wave after a pause between cardiac cycles 1,5 seconds and more. In simulation the bigeminy, we observed the growth of the pressure inside the tube in 50% of time – in each wave after the ES. So, in a real human vessel it can be observed the hemodynamic arterial hypertension that is not stable, registered in 50% of time.
The data of pressure measurements see in Figure 6.
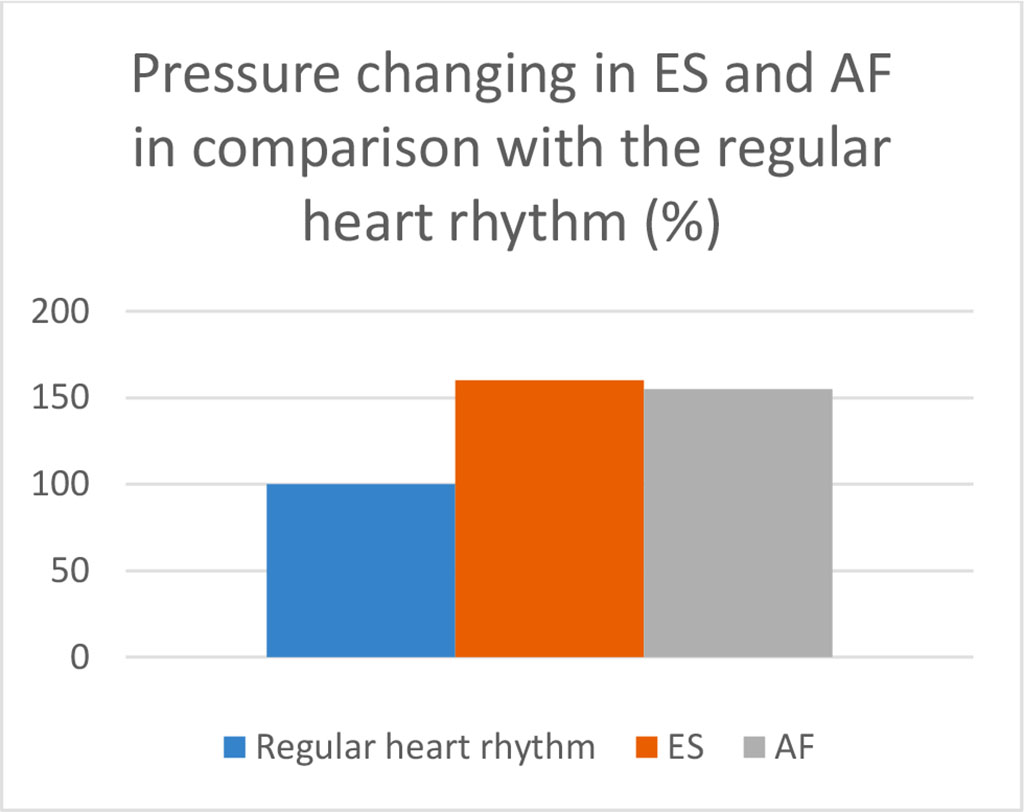
Figure 6. Pressure in the marginal site of the atheroma 50% in diameter when simulating ES (data for the pulse wave of the first post-extrasystolic contraction) and AF (data for the pulse wave after a pause between ventricular contractions of 1,5 seconds) in comparison with pressure at the regular heart rate ( p<0,05).
Our results allowed us to simulate the distribution of pressure inside the arterial vessel, in the presence of atheroma and in the case of ES or AF (Figure 7).
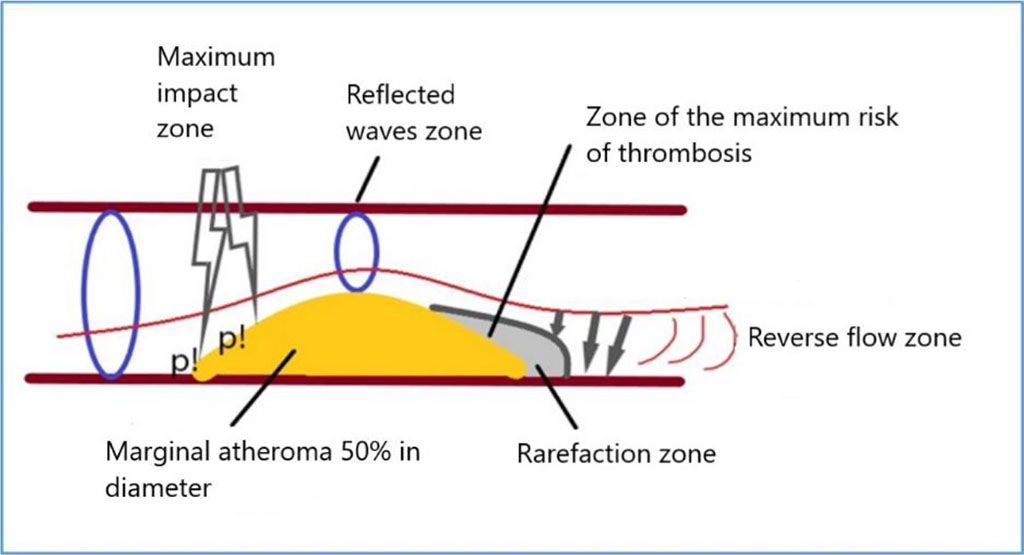
Figure 7. Scheme of pressure distribution on atheroma during ES or AF simulation. Note: p! – the maximum pressure.
An increased pulse wave, after a long pause between cardiac cycles, has a maximum mechanical impact on the proximal marginal zone of atheroma, then, passing through the area of stenosis, causes the appearance of reflected and standing waves. In the distal part of the atheroma, a marginal zone appears with a slowdown in blood flow, up to a reverse flow of fluid, which in a real arterial vessel can create favorable hemodynamic conditions for the formation of a thrombus on the atheroma. The next pulse wave can move a fresh thrombus further along the blood flow, which will cause the development of arterial thromboembolic complications in a real arterial vessel.
Most of the existing models for studying the arterial pathophysiological processes are mathematical or computed. There are very few physical models because their creation is mostly associated with the difficulties of construction, high prices of details and mismatch of the real biological system. For our investigation, we created the original experimental “Device for modeling of intra-arterial circulation” for the physical modeling. The unique construction of it, made possible to perform the imitation of the arterial vessel and to study parameters of hemodynamics, measured mathematically and evaluated visually with different methods. We studied the intra-arterial hemodynamics in regular heart rhythm and in arrhythmias, such as ES and AF with different pauses between pulse waves.
This experimental work is the part of our clinical investigation with participation of 608 patients. Moreover, it was performed to implement our clinical results. Being practicing cardiologists, we observed the hemodynamic clinical parameters in our patients in heart arrhythmias. So, we revealed the increase of the parameters of the blood speed velocity, volume blood flow in the first post-extrasystolic wave and in the pulse wave after long pause (≥1,5 sec) in AF measured by ultrasound Doppler on the different arteries (common carotid arteries, posterior tibial arteries), as well as the main parameters of arteries kinetics (speed, acceleration, power, work) calculated by the digital sphygmography. Also in the patients with heart arrhythmias we observed the statistically significant more frequent and severe arterial atherosclerosis. Our clinical results were presented in our previously published papers [13-15].
Creating our device, we wanted to study visually and mathematically the pathophysiological processes in the arteries in the heart arrhythmias for the experimental explanation of the data of the clinical part of our work.
Heart arrhythmias, especially ES and AF, cause significant changes in intra-arterial hemodynamics, which can become a part of the pathophysiology of atherosclerotic plaque growth. One of the main traditional risk factors for atherosclerosis is high arterial blood pressure. In our experiment, we demonstrated an increase in pressure inside the rotameter tube during the spreading of pulse waves of the first post-extrasystolic contraction and after a long pause between cardiac cycles in AF. Moreover, we were able not only to show the increase, but also demonstrate its distribution inside the artery in the area of existing atheroma. Thus, the edge zones of the plaque underwent a maximum mechanical impact of the pressure waves. This effect contributes to the traumatization and further growth of the plaque along and against the blood flow in the real arterial vessel. In this case, the border areas of the plaque and the intact vessel become the most vulnerable areas. Thus, the intact region of the artery retains its elastic properties, and when exposed to excess pressure, it is able to damp and smooth its oscillations, expanding with the passage of an increased pulse wave. The area of the vessel with atheroma loses such properties, being, in fact, an inert tube that is not capable of stretching. When one part of the artery is capable of stretching, and the other is not, there is an additional trauma effect on the border zone due to the difference in elastic properties. Multiply repeated exposure of an increased pulse wave (for example, with allorhythmias, bradysystolic AF) leads to increased traumatization of this area, which contributes to the maintenance of chronic inflammation and the progression of plaque growth. As the plaque reaches hemodynamic significance, its growth begins to accelerate even more, since these hemodynamic mechanisms become decisive and leading in pathophysiology at this stage. Plaque hemodynamics supports its growth. In this sense, "atheroma builds itself." This mechanism, among other things, can explain the predominant localization of atheromas in the area of bi- and trifurcations of the arteries, along the large radius of the aortic arch - precisely those parts of the arterial vascular system that are subject to excessive mechanical action of an increased pulse wave. In addition, the physical mechanisms described above create the conditions for the formation of complicated atheroma.
Moreover, we observed a rarefaction zone behind the atheroma, with a turbulent fluid flow and with the possibility of fluid reverse flow. This slowing down of blood flow behind the plaque creates favorable conditions for the formation of arterial thrombosis. It is a well-known fact that one of the predisposing physical factors of an intravascular thrombus is precisely the slowing of blood flow, as firstly was described by Rudolf Virchow.
The intra-arterial hemodynamic processes that described above, we could observe even in the simulation of the plaque that is hemodynamically insignificant (we made the atheroma with 50% of stenosis in diameter). Hence, we believe in hemodynamic importance of each plaque that reduces the arterial outlet diameter, when the patient has different cardiac arrhythmias – especially ES or AF. During the spreading of the first wave after a long pause between cardiac cycles (the first post-extrasystolic wave in ES, the first wave after the long pause between ventricular contractions in bradysystolic AF), the characteristics of intra-arterial hemodynamics in insignificant atheromas are becoming similar as in hemodynamically significant atheromas in regular heart rhythm (turbulent blood flow, reflected, standing waves etc.). So, this situation is the example of the one of the main dialectics laws – the transforming of the quantity (pulse waves in heart arrhythmias) in the new quality – the hemodynamically significance of atheroma with its further progression.
With the understanding of this mechanism, it is becoming clear the situation in the real patients when in the normal levels of blood serum lipids the patient has the progression of atheromas and even the cardiovascular complications, despite of the standard therapy. In new era of lipid-lowering drugs, with their wide using, the cardiologists and doctors of the other specialties pay their attention to the lipids levels. However, anyway, in many situations we can observe the clinical manifestations worsening of the general atherosclerotic process. In addition, the mortality from the cardiovascular diseases is still the leading cause of the deaths all over the world. That is why the determination of the additional risk factors of atherosclerosis is very important for the better strategies in its prevention and treatment.
The described mechanism can implement the existing theories of atherosclerosis – including in the list of the risk factors the additional risk factor – cardiac arrhythmias (ES and AF), that in some moments can play the leading pathophysiological role in atheroma progression. The importance of this process in clinical practice becomes clear, because we can explain the more often and severe atherosclerosis in patients with ES and AF.
In our future investigations, we will focus on intra-arterial hemodynamics in the special situations - in the bifurcation of the main arteries and in the simulation of the orifice of the renal artery that is also necessary to study to understand further the mechanical factors of atherosclerotic process.

|
||