- Home
- About the Journal
- Peer Review
- Editorial Board
- For Authors
- Reviewer Recognition
- Archive
- Contact
- Impressum
- EWG e.V.
Cite as: Archiv EuroMedica. 2025. 15; 2. DOI 10.35630/2025/15/2.208
Aims: This study aimed to evaluate the clinical outcomes of using polypropylene and polyester mesh implants in inguinal hernia repair via the Lichtenstein technique, employing artificial intelligence and machine learning tools for statistical analysis.
Methods: A total of 58 patients with primary unilateral inguinal hernias were operated on using the Lichtenstein technique over a three-year period. They were divided into two groups: Group A (38 patients, mean age 58.05 years; 34 males, 4 females) received polypropylene meshes, while Group B (20 patients, mean age 50.05 years; all males) received polyester meshes. Data analysis was conducted using Python, incorporating machine learning algorithms to assess key clinical parameters including operative time, duration of hospital stay, and postoperative complications.
Results: Statistical analysis using independent samples t-tests revealed no significant differences between the two groups in terms of hernia duration, operative time, length of hospital stay, or rate of postoperative complications.
Conclusions: Polypropylene and polyester meshes demonstrate comparable performance in Lichtenstein hernia repair with no significant differences in surgical outcomes. Mesh selection may therefore be guided by patient-specific factors, surgeon preference, or cost considerations, rather than expected clinical superiority.
Keywords: Inguinal hernia, Lichtenstein repair, Polypropylene mesh, Polyester mesh, Artificial intelligence, Machine learning, Python.
In the sixteenth’s century BC, the ancient Egyptians were the first to recognize inguinal hernia and even more were the pioneers to record epigastric hernia as an occupational disease. Later on, in ancient Greece, the word “prolapse” was used to describe “hernia”, till the early 1950’s of the twenty’s century when Henri Fruchaud was the first to use the term “groin hernia” which could be defined as the protrusion of the abdominal contents (Vesicare and/or omentum) through the internal inguinal ring or facia transversalis for oblique and direct inguinal hernias respectively or through the femoral canal for femoral hernias beneath the skin of the groin [1-3].
A 36% rise in the global incidence of hernia were observed during the last 3 decades, where the numbers jumped from about 23.92 million to 32.53 million cases of hernia in-between the years 1990 and 2019. On the other hand, the age-standardized prevalence rates [ASRs] declined from 488.3 to 407.9 cases per 100,000 individuals (about 16.5%,). In parallel, the overall mortality from hernia upsurged by about 19.77%, yet the ASRs significantly dropped by about 40.39%. This contrast suggests that in spite of escalating global prevalence of hernia due to variable aspects e.g., alternations affecting dietary habits, lifestyle and improvements in the courses of diagnostic capabilities, the age-specific incidence is declining, reflecting the impact of improved public health measures. Furthermore, ASRs also observed that in spite both males and females exhibited similar declining patterns, still males consistently registering higher rates among categories [4-6].
The average cost of hernia repair surgery in the United States could reach up to $12,500, with average of $11,500 for an inpatient hernia repair and $6,400 for an outpatient procedure. The cost is much less when using Lichtenstein repair, adding to its advantages over laparoscopic repair regarding the cost, operative time and the possibility of using local anesthesia [7-9].
Surgical mesh’s pore size, area density, fiber diameter, scaffold thickness, tear resistance, Suture retention strength, ball burst uniaxial tensile and lap shear testing are the physical characteristics which determine its performance, pros and cons during any given hernioplastic operation [10-12].
Polypropylene is categorized among the first group of mesh implants according to Deeken & Lake mesh classifications system being a nonabsorbable polymer of a high tensile strength, nonpolar, electrostatically neutral and resistant to biological degradation and highly hydrophobic presented in both coated and uncoated forms; either mono or multifilamentous. Because of the intense inflammatory reaction leading to the formation of thick scar and mesh contraction which can increase the incidence of hernia recurrence by (30_50%). The merge of light weight PP mesh has dramatically decreased the incidence of these complications. Polyester is categorized among the first group of mesh implants according to Deeken & Lake mesh classifications system being polar, multifilamentous, hydrophilic, and coated by collagen preventing adhesions, so it could be used intraperitoneally ‘inlay’ [13-15].
Furthermore, polyester is considered as a safe and effective alternative to polypropylene, as it is associated with less early and late postoperative pain and shorter hospital stays, as polyester is associated with much fewer analgesic requirements in comparison to polypropylenes, in addition to the induction of an early intense inflammatory reaction which stimulates more tissue ingrowth and integration with higher connective tissue formation in comparison to polypropylenes. Therefore, results in less mesh contractions, less fibrosis and lesser stretching in the sensory nerves surrounding the mesh, thus resulting in less postoperative pain [16,17]. However, the incidence of seroma formation, wound infection and recurrences showed no significant differences between both scaffolds [18-19].
Although there are guidelines on reporting statistics in medical papers, a checklist on the more general and commonly seen aspects of statistics to assess when peer-reviewing an article is needed, still many authors and editors of medical articles doesn’t have a sufficient knowledge of statistics or may be unconvinced about the significance of applying accurate statistics during preforming reach. The misuse of statistics in medical field is a common defect which may lead to detrimental consequences to healthcare [20,21].
The expanding role of statistical science in surgery and modern medicine includes the following aspects; Driving Precision and Personalization in Surgical Decision-Making; Statistical science is at the heart of today’s personalized medicine. With tools like logistic regression, Bayesian inference, and machine learning, doctors can now predict individual patient outcomes, customize surgical procedures, and pinpoint risk factors with remarkable precision. For instance, to showcase how supervised machine learning models can forecast visual results in macular hole surgeries, giving surgeons the insights, they need to make well-informed decisions before the operation [22].
In the realm of surgical education, statistical analysis plays a crucial role not just in assessing skills but also in improving training methods. A study by Frati et al. revealed that a structured preoperative warm-up can significantly boost the surgical performance of residents, as shown by quantitative performance metrics that validate the results. This highlights how statistics can objectively enhance surgical training [23,24].
Innovative systems like ARTEMIS utilize advanced statistical models to uncover patterns in ICU data, allowing for the early detection of life-threatening situations. These tools empower healthcare professionals to navigate complex critical care scenarios with data-driven insights, ultimately reducing mortality rates and improving patient safety [25].
In today’s world of distributed healthcare data, federated learning frameworks—rooted in statistical modeling—enable collaborative training of diagnostic models while safeguarding patient privacy. Guan et al. demonstrate how this method is transforming medical imaging, facilitating highly accurate diagnoses while adhering to data protection regulations like HIPAA and GDPR [26].
Medical data can often be messy, incomplete, or even missing entirely. Recently, transformer-based models have proven to be effective statistical tools for filling in those gaps while keeping accuracy and reliability intact. Khan introduced an innovative model specifically for EEG amplitude data, emphasizing the vital importance of advanced statistical methods in preserving data integrity for further analysis [27].
As we move towards a more interdisciplinary approach in medical education, statistical evaluations are playing a key role in assessing educational reforms and the effectiveness of curricula. Yan et al. utilized quantitative analyses to create a multidisciplinary framework for "New Medicine," ensuring that training aligns with the evolving needs of AI, genomics, and personalized healthcare [28].
Scalable Analysis of Complex and High-Volume Data sets; When it comes to handling large healthcare datasets, Python shines. Unlike Excel, which can feel cramped with its row and column limits, Python can easily manage and analyze everything from electronic health records to detailed medical imaging data. This ability to scale makes it a perfect fit for hospital systems, clinical research, and big data initiatives in fields like genomics and epidemiology [29].
Python boasts a fantastic array of specialized libraries such as Biopython, SciPy, Pandas, and NumPy, offering incredible flexibility for scientific computing. For example, Khodja et al. utilized Biopython for genomic comparisons of SARS-CoV-2, while López-Fernández et al. introduced the bioScience Python library to tackle large-scale bioinformatics analytics [30].
With Python, you can set up automated workflows for data preprocessing, analysis, and visualization, which not only boosts reproducibility but also enhances efficiency. Wu points out that Python-driven data mining pipelines are far superior to manual tasks in Excel, cutting down on human error and speeding up research timelines [31]
Python excels in creating dynamic and interactive visualizations through libraries like Plotly, Matplotlib, and Seaborn. This capability helps clinicians and researchers spot trends and share insights effectively. Shinde & Shivhare noted that such visualizations significantly enhance the interpretability of machine learning models used in medical diagnostics [32].
When it comes to crafting AI models for healthcare, Python is the go-to language. Take GlioPredictor, for instance—this tool uses deep learning to predict glioma risk and is built on Python’s robust AI ecosystem, which includes frameworks like TensorFlow and PyTorch. Unfortunately, Excel just doesn’t cut it for this level of sophisticated modeling [33].
Whether it’s geoscience or surgical analytics, Python makes it easy to blend various datasets and fields. A great example is the work by Zhang Zhou et al., who developed Geochemistry π, a Python-based AutoML framework that can be tailored for healthcare analytics. This really highlights how Python is key in connecting different disciplines to tackle global challenges [34-35].
Our study was conducted at the clinical base of the Department of Operative Surgery and Clinical Anatomy of RUDN University (Moscow, Russia). A total of 58 patients with inguinal hernia were operated on using Liechtenstein technique in last 3 years. They were divided into 2 groups.
Group A (38 patients, mean age 58.05 years; 34 males, 4 females) received polypropylene meshes, while Group B (20 patients, mean age 50.05 years; all males) received polyester meshes.
The demographics of patients and study design for both groups, is shown in Table 1.
Table 1. The demographics of patients and study design among both groups
| Group A (Polypropylene) | Group B (Polyester) | Grand total | |
| Male | 34/38 (89.5%) | 20/20 (100%) | 54/58 (93.1%) |
| Female | 4/38 (10.5%) | 0/20 (0%) | 4/58 (6.9%) |
| Grand total | 38/38 (100%) | 20/20 (100%) | 58/58 (100%) |
| Type of study | Combined Retrospective-Prospective | Combined Retrospective-Prospective |
The average age and hernia dimensions among both groups, is shown in Table 2.
Table 2. Average age and hernia dimensions for both groups
| Characteristic | Group A (Polypropylene) | Group B (Polyester) | Grand Total |
| Average Age (Years) | 58.05 | 50.05 | 55.29 |
| Average Duration of Herniation (Months) | 35 | 22.75 | 30.77 |
| Average Hernia Length (cm) | 8.24 | 6.25 | 7.55 |
| Average Hernia Width (cm) | 5.12 | 4.75 | 4.99 |
| Average Hernia Height (cm) | 3.5 | 2.8 | 3.36 |
| Average Hernia Volume (cm³) | 138.45 | 53.9 | 109.29 |
Furthermore, the distribution of hernia site (right/left) and type (direct/oblique) among both groups, is shown in table3.
Table 3. The distribution of hernia site (right/left) and type (direct/oblique) for both groups
| Hernia side and type | Group A | Group B | Total | Group A (%) | Group B (%) |
| Hernia Site (Right) | 26 | 12 | 38 | 68.42% | 31.58% |
| Hernia Site (Left) | 12 | 8 | 20 | 60.00% | 40.00% |
| Hernia Type (Direct) | 19 | 8 | 27 | 70.37% | 29.63% |
| Hernia Type (Oblique) | 19 | 12 | 31 | 61.29% | 38.71% |
distribution of the associated comorbidities among both groups is shown in Table 4.
Table 4. The types and distribution of associated comorbidities for both groups
| Associated comorbidly | Group A | Group B | Grand total |
| Hypertension (HTN) | 13/38 (34.2%) | 6/20 (30%) | 19/58 (32.8%) |
| Coronary Heart Disease (CHD) | 1/38 (2.6%) | 1/20(5%) | 2/58 (3.4%) |
| Sinus bradycardia | 1/38 (2.6%) | 0/20 (0%) | 1/58 (1.7%) |
| Chronic obstructive pulmonary disease (COPD) | 1/38 (2.6%) | 0/20 (0%) | 1/58 (1.7%) |
| Pulmonary hypertension (PHTN) | 0/38 (0%) | 1/20 (5%) | 1/58 (1.7%) |
| Varicocele | 1/38 (2.6%) | 1/20(5%) | 2/58 (3.4%) |
| Urolithiasis | 1/38 (2.6%) | 0/20 (0%) | 1/58 (1.7%) |
| Grand total | 18/38 (47.3%) | 9/20 (45%) | 27/58 (46.5%) |
We used polypropene (Figure 1) and polyester (Figure 2) mesh implants while preforming Lichtenstein repair for patients in both groups. The fine texture of polyprolene and polyester is shown in Figure 3.
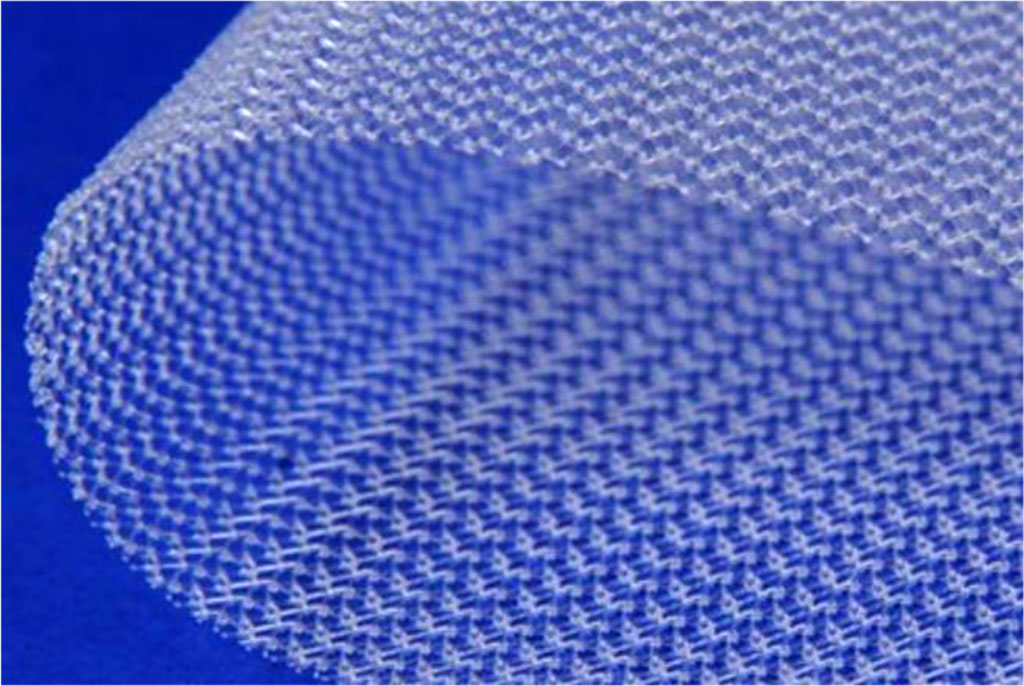
Fig. 1. Polypropene surgical mesh implant.
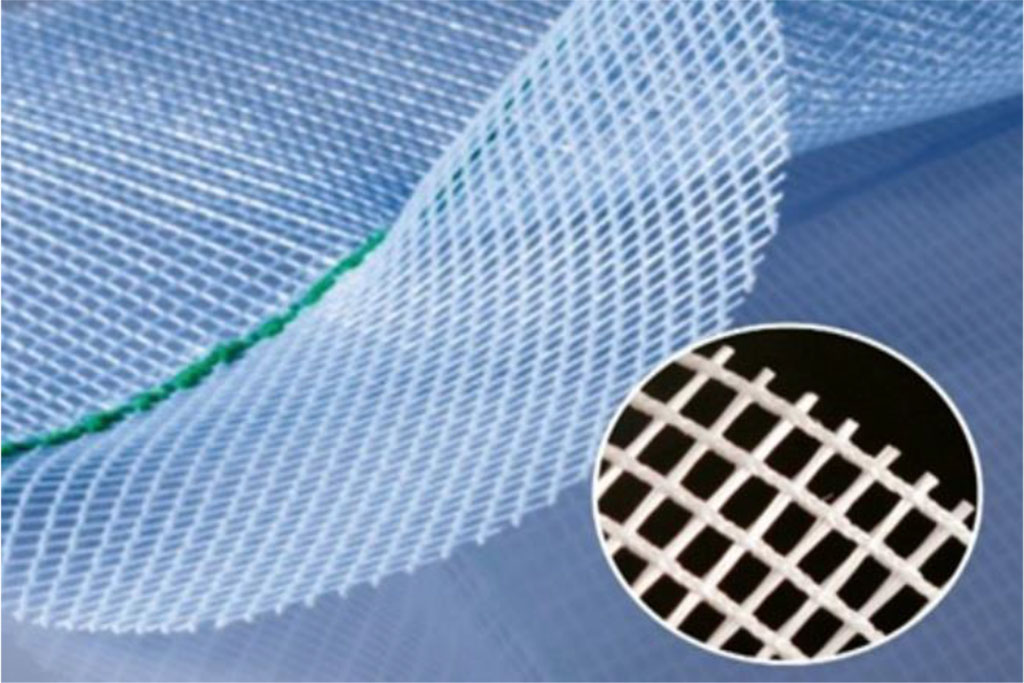
Fig. 2. Polyester surgical mesh.
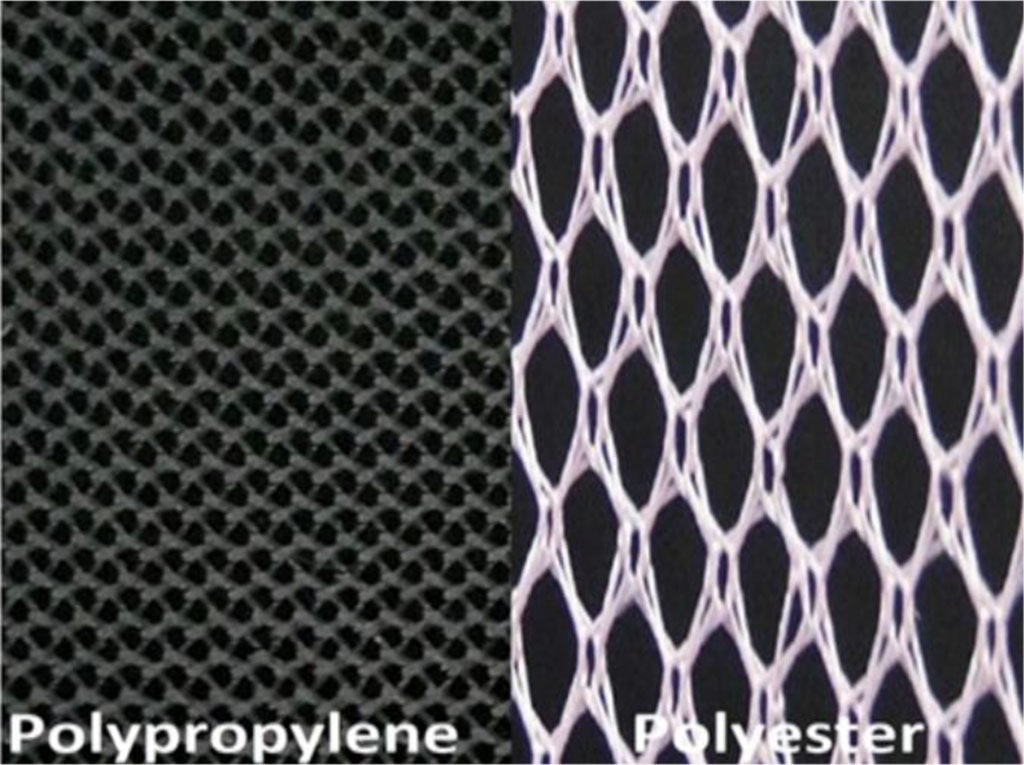
Fig. 3. The fine texture of polyprolene and polyester.
During the preoperative period, we evaluated our patients and checked the surgical fitness using traditional methods, including revision of complaints, anamnesis, clinical and instrumental methods of investigation.
All patients admitted to the hospital for the surgery underwent a standard outpatient examination and investigations by the guidelines as follows:
Inguinoscrotal ultrasonography allowed us to determine the nature of the hernial protrusion, the contents of the hernia sac, the dimensions of the hernia sac and the external inguinal ring size. In addition, inguinoscrotal ultrasonography helped us to establish a differential diagnosis with other diseases related to inguinal hernias.
Differential diagnosis of inguinal hernias is included with lymphadenitis, lymphadenopathies, soft tissue neoplasms, inflammatory infiltrate and abscess, endometrioid cyst, aneurysm, varicose vein transformation and femoral hernias.
For this purpose, we used the Acuson X300 ultrasonic device from Siemens (Germany) with a VF13-5 linear sensor, As shown in Figure 4.
The sensor was placed in the groin area parallel to the inguinal ligament and 1.5-2.0 cm above it. In some cases, ultrasound of the inguinal region allowed us to determine the nature of the hernial protrusion, the contents of the hernial sac, determine the size of the hernial sac, and its condition.
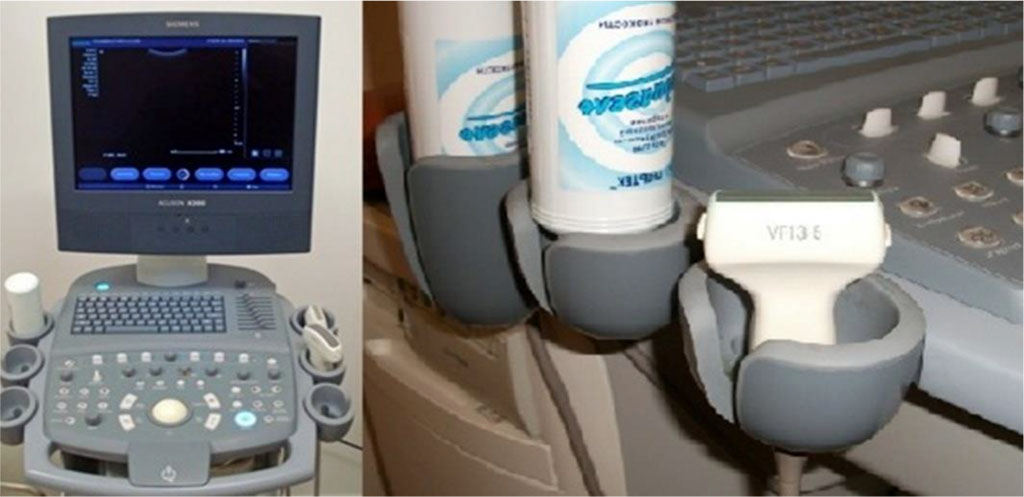
Fig. 4. The Acuson X300 ultrasonic device from Siemens.
The statistical analysis of the obtained data was conducted using descriptive statistics, including the calculation of the arithmetic mean (M), standard error, median, mode, standard deviation (s), range, minimum (Min), and maximum (Max).
The computations were performed using the statistical module of the Python programming language, which is an artificial intelligence-assisted statistical software, utilizing machine learning techniques.
The correlation between patients’ age, characteristics of hernia (duration of herniation, hernia dimensions and size of the external inguinal ring with total hospital stay and operative time for group A, is shown in Table 5.
Table 5. The correlation between patients’ age, characteristics of hernia, total hospitalization duration and operative time for group A
| Metric | Total Hospitalization (bed/day) | Age | Duration of Herniation (Months) | Hernia Length (cm) | Hernia Width (cm) | Hernia Height (cm) | Hernia Volume (cm³) | External Inguinal Ring Size | Operative Time (Minutes) |
| Mean | 4.95 | 58.89 | 34 | 8.05 | 5.07 | 3.5 | 139.35 | 2.51 | 51.89 |
| Standard Error | 0.19 | 1.66 | 6.43 | 0.61 | 0.30 | 0.40 | 42.63 | 0.12 | 2.90 |
| Median | 5 | 62 | 24 | 7 | 4 | 3 | 48 | 2.5 | 45 |
| Mode | 5 | 62 | 24 | 6 | 4 | 3 | 48 | 2.5 | 40 |
| Standard Deviation | 1.15 | 10.07 | 39.13 | 3.71 | 1.83 | 1.79 | 259.29 | 0.76 | 17.65 |
| Sample Variance | 1.33 | 101.43 | 1531 | 13.77 | 3.36 | 3.21 | 67229.46 | 0.58 | 311.60 |
| Kurtosis | 0.45 | 1.26 | 4.97 | -0.11 | 1.14 | 3.67 | 24.06 | -0.27 | 1.99 |
| Skewness | 0.80 | -1.39 | 2.16 | 0.82 | 1.06 | 1.83 | 4.59 | 0.47 | 1.14 |
| Range | 5 | 40 | 178 | 15 | 8 | 7 | 1524 | 2.5 | 85 |
| Minimum | 3 | 30 | 2 | 2 | 2 | 2 | 6 | 1.5 | 25 |
| Maximum | 8 | 70 | 180 | 17 | 10 | 9 | 1530 | 4 | 110 |
| Sum | 183 | 2179 | 1258 | 298 | 187.5 | 70 | 5156 | 92.9 | 1920 |
| Count | 37 | 37 | 37 | 37 | 37 | 20 | 37 | 37 | 37 |
The correlation between patients’ age, characteristics of hernia (duration of herniation, hernia dimensions and size of the external ring) with total hospitalization duration and operative time for group B, is shown in Table 6.
Table 6. The correlation between patients’ age, characteristics of hernia, total hospitalization duration and operative time for group B
| Metric | Total Hospitalization (bed/day) | Age | Duration of Herniation (Months) | Hernia Length (cm) | Hernia Width (cm) | Hernia Height (cm) | Hernia Volume (cm³) | External Inguinal Ring Size | Operative Time (Minutes) |
| Mean | 5.10 | 50.05 | 23.85 | 6.25 | 4.75 | 2.8 | 53.9 | 2.45 | 48.5 |
| Standard Error | 0.24 | 3.52 | 6.19 | 0.64 | 0.27 | 0.37 | 14.47 | 0.15 | 2.33 |
| Median | 5 | 54 | 18 | 5 | 5 | 3 | 27.5 | 2.5 | 45 |
| Mode | 4 | 41 | 36 | 5 | 5 | 3 | 25 | 2.5 | 45 |
| Standard Deviation | 1.07 | 15.74 | 27.68 | 2.84 | 1.21 | 0.84 | 64.70 | 0.69 | 10.40 |
| Sample Variance | 1.15 | 247.84 | 766.24 | 8.09 | 1.46 | 0.70 | 4185.78 | 0.47 | 108.16 |
| Kurtosis | 1.12 | -1.27 | 7.36 | -0.18 | -0.54 | -0.61 | 4.81 | -0.04 | -0.33 |
| Skewness | 0.93 | -0.38 | 2.42 | 0.94 | 0.34 | 0.51 | 2.27 | 0.33 | -0.26 |
| Range | 4 | 50 | 118 | 9 | 4 | 2 | 243 | 2.5 | 40 |
| Minimum | 4 | 20 | 2 | 3 | 3 | 2 | 9 | 1.5 | 25 |
| Maximum | 8 | 70 | 120 | 12 | 7 | 4 | 252 | 4 | 65 |
| Sum | 102 | 1001 | 477 | 125 | 95 | 14 | 1078 | 49 | 970 |
| Count | 20 | 20 | 20 | 20 | 20 | 5 | 20 | 20 | 20 |
The correlation between average operative time and hernial dimensions among both groups, is shown in Table 7.
Table 7. The correlation between average operative time and hernia dimensions among both groups.
| Operative Results | Group A (Polypropylene) | Group B (Polyester) | Median |
| Average Operative Time (Minutes) | 51.97 | 48.5 | 50.86 |
| Average Length of Hernial Sac (cm) | 8.08 | 6.8 | 7.64 |
| Average Width of Hernial Sac (cm) | 4.68 | 3.9 | 4.41 |
| Average Height of Hernial Sac (cm) | 3.25 | 2.69 | 3.10 |
| Average Volume of Hernial Sac (cm³) | 171.55 | 72.48 | 137.39 |
The average mesh dimensions in both groups are shown in Table 8.
Table 8. Mesh dimensions.
| Mesh Characteristic | Group A (Polypropylene) | Group B (Polyester) | Median |
| Average Mesh Length (cm) | 7.66 | 7.8 | 7.71 |
| Average Mesh Width (cm) | 11.61 | 16.8 | 13.40 |
| Average Mesh Area (cm²) | 93.32 | 127.8 | 105.21 |
The correlation between hernia site and type, anesthetics type, and concomitant comorbidities are shown in Table 9.
Table 9: Distribution of Hernia Site, Hernia Type, Anesthesia Type, and Comorbidities Across Groups A and B.
| Row Labels | Group A | Group B | Total | Group A (%) | Group B (%) |
| Hernia Site (Right) | 26 | 12 | 38 | 68.42% | 31.58% |
| Hernia Site (Left) | 12 | 8 | 20 | 60.00% | 40.00% |
| Hernia Type (Direct) | 19 | 8 | 27 | 70.37% | 29.63% |
| Hernia Type (Oblique) | 19 | 12 | 31 | 61.29% | 38.71% |
| Type of Anesthesia (Spinal) | 34 | 20 | 54 | 62.96% | 37.04% |
| Type of Anesthesia (Endotracheal) | 3 | 0 | 3 | 100.00% | 0.00% |
| Type of Anesthesia (Local) | 1 | 0 | 1 | 100.00% | 0.00% |
| Comorbidities Present | 18 | 9 | 27 | 47.3% | 45% |
This table presents the distribution of various factors related to inguinal hernia repair, comparing Group A (patients operated with Polypropylene mesh) and Group B (patients operated with Polyester mesh). The factors included:
Hernia Site: Right and Left-sided inguinal hernias.
Hernia Type: Direct and Oblique types of hernias.
Type of Anesthesia: The distribution of spinal, endotracheal, and local anesthesia used during the procedures.
Comorbidities Present: The presence of comorbidities in patients of both groups.
The table includes both sum values (counts) and the percentage of each category in relation to the Grand Total, which represents the overall count across both groups. The percentages provide a comparison between Group A and Group B, highlighting differences in the distribution of hernia types, anesthesia methods, and comorbidity prevalence between the two groups.
The correlation between the preoperative data; duration of hernaition, hernia side (Right/left), hernia dimensions and the size of external hernia ring (by clinical examination and by ultrasonographic examination) with intraoperative data; mesh dimension and operative time, with postoperative data; the total hospital stays, as shown in Table 10.
Table 10: Comparison of Hernia Characteristics, Surgical Parameters, and Hospitalization Data by Hernia Site (Right/Left).
| Parameter | Group A (Left) | Group A (Right) | Group B (Left) | Group B (Right) | Grand Total (Left) | Grand Total (Right) |
| Sum
of Total hospitalization duration (beds/day) |
5.16 | 4.46 | 5.1 | 5.08 | 5.15 | 4.92 |
| Total Hospitalization Duration (beds/day) | 5.17 | 5.00 | 5.13 | 5.09 | 5.15 | 5.04 |
| Duration of Herniation (Months) | 26.33 | 36.29 | 16.50 | 25.09 | 22.40 | 32.44 |
| Hernia Length (cm) | 7.58 | 8.52 | 5.88 | 6.18 | 6.90 | 7.72 |
| Hernia Width (cm) | 4.75 | 5.62 | 4.25 | 5.09 | 4.55 | 5.44 |
| Hernia Height (cm) | 2.83 | 4.20 | 2.33 | 3.00 | 2.67 | 4.09 |
| Hernia Volume (cm³) | 71.50 | 189.14 | 41.00 | 50.00 | 59.30 | 141.31 |
| External Inguinal Ring Size (cm) | 2.41 | 2.57 | 2.25 | 2.50 | 2.34 | 2.55 |
| Operative Time (Minutes) | 55.00 | 49.76 | 48.13 | 49.09 | 52.25 | 49.53 |
| Length of Hernia Sac (cm) | 7.42 | 8.43 | 6.00 | 7.27 | 6.85 | 8.03 |
| Width of Hernia Sac (cm) | 4.58 | 4.98 | 3.63 | 4.23 | 4.20 | 4.72 |
| Height of Hernia Sac (cm) | 3.00 | 3.53 | 2.33 | 3.00 | 2.76 | 3.40 |
| Volume of Hernia Sac (cm³) | 136.67 | 213.00 | 60.00 | 82.68 | 106.00 | 168.20 |
| Mesh Length (cm) | 7.50 | 8.14 | 7.13 | 8.45 | 7.35 | 8.25 |
| Mesh Width (cm) | 11.67 | 11.71 | 24.00 | 12.09 | 16.60 | 11.84 |
| Mesh Area (cm²) | 92.50 | 100.29 | 160.88 | 109.36 | 119.85 | 103.41 |
This table compares the key parameters of hernia repair in Groups A (Polypropylene Mesh) and B (Polyester Mesh), categorized by hernia site (Left and Right).
Hospitalization Duration: Averaged around 5 days across all groups, with minimal variation.
Hernia Dimensions: Group A showed larger hernia volumes and lengths, particularly for right-sided hernias (189.14 cm³ vs. Group B's 50.00 cm³).
Operative Time: Similar across groups, averaging ~50 minutes.
Mesh Area: Group B consistently used larger meshes (160.88 cm² for left and 109.36 cm² for right) compared to Group A.
Herniation Duration: Longer in Group A (e.g., 36.29 months for right hernias vs. Group B’s 25.09 months).
Overall, Group A exhibited larger hernia sizes, while Group B utilized larger mesh areas, indicating differences in surgical strategies.
The correlation between the preoperative data; duration of hernaition, hernia type (Direct/Oblique), hernia dimensions and the size of external hernia ring (by clinical examination and by ultrasonographic examination) with intraoperative data; mesh dimension and operative time, with postoperative data; the total hospital stays, as shown in Table 11.
Table 11. Comparison of Hernia Characteristics, Surgical Parameters, and Hospitalization Data by Hernia Type (Direct/Oblique).
| Parameter | Group A (Direct) | Group A (Oblique) | Group B (Direct) | Group B (Oblique) | Grand Total (Direct) | Grand Total (Oblique) |
| Sum
of Total hospitalization duration (beds/day) |
4.73 | 5.17 | 5.25 | 5 | 4.88 | 5.10 |
| Total Hospitalization Duration (days) | 5.16 | 4.74 | 5.00 | 5.25 | 5.10 | 4.89 |
| Duration of Herniation (Months) | 47.26 | 20.21 | 25.00 | 16.50 | 38.65 | 19.11 |
| Hernia Length (cm) | 9.84 | 6.63 | 6.58 | 5.75 | 8.58 | 6.37 |
| Hernia Width (cm) | 5.82 | 4.42 | 4.67 | 4.88 | 5.37 | 4.56 |
| Hernia Height (cm) | 3.60 | 3.40 | 2.75 | 3.00 | 3.36 | 3.36 |
| Hernia Volume (cm³) | 183.79 | 93.11 | 55.33 | 51.75 | 134.06 | 80.85 |
| External Inguinal Ring Size (cm) | 2.72 | 2.39 | 2.63 | 2.19 | 2.68 | 2.33 |
| Operative Time (Minutes) | 59.21 | 45.00 | 51.67 | 43.75 | 56.29 | 44.63 |
| Length of Hernia Sac (cm) | 9.84 | 6.32 | 8.08 | 4.88 | 9.16 | 5.89 |
| Width of Hernia Sac (cm) | 5.13 | 4.24 | 3.75 | 4.13 | 4.60 | 4.20 |
| Height of Hernia Sac (cm) | 3.50 | 2.97 | 2.75 | 2.00 | 3.20 | 2.91 |
| Volume of Hernia Sac (cm³) | 227.21 | 115.89 | 101.13 | 29.50 | 178.40 | 90.30 |
| Mesh Length (cm) | 8.84 | 6.47 | 8.25 | 7.13 | 8.61 | 6.67 |
| Mesh Width (cm) | 12.26 | 10.95 | 20.33 | 11.50 | 15.39 | 11.11 |
| Mesh Area (cm²) | 116.21 | 70.42 | 155.75 | 85.88 | 131.52 | 75.00 |
The correlation between the preoperative data; duration of herniation, hernia dimensions and the size of external hernia ring (by clinical examination and by ultrasonographic examination) with intraoperative data; mesh dimension and operative time, with postoperative data; the total hospital stays, with the types of anesthesia used in each group, as shown in Table 12.
Table 12: Comparison of Types of Anesthesia (Endotracheal, Local, Spinal) between Group A and Group B.
| Metrics | Endotracheal (Group A) | Endotracheal (Group B) | Local (Group A) | Local (Group B) | Spinal (Group A) | Spinal (Group B) | Grand Total |
| Sum
of Total hospitalization duration (beds/day) |
4.33 | - | 5 | - | 5 | 5.1 | 5 |
| Duration of Herniation (Months) | 104 | - | 0 | - | 33.74 | 21.6 | 29.55 |
| Hernia Length (cm) | 13 | - | 3 | - | 7.55 | 6.25 | 7.55 |
| Hernia Width (cm) | 8.33 | - | 2 | - | 5.12 | 4.75 | 4.99 |
| Hernia Height (cm) | 3 | - | - | - | 3.5 | 2.8 | 3.36 |
| Hernia Volume (cm³) | 162.33 | - | 6 | - | 138.45 | 53.9 | 109.29 |
| External Inguinal Ring Size (cm) | 46.67 | - | 30 | - | 52.11 | 48.5 | 50.86 |
| Operative Time (Minutes) | 3.17 | - | 2.5 | - | 2.55 | 2.45 | 2.52 |
| Length of Hernia Sac (cm) | 11.67 | - | 4 | - | 8.08 | 6.8 | 7.48 |
| Width of Hernia Sac (cm) | 6.33 | - | 2.5 | - | 4.68 | 3.9 | 4.41 |
| Height of Hernia Sac (cm) | 3.67 | - | 2 | - | 3.25 | 2.69 | 3.10 |
| Volume of Hernia Sac (cm³) | 283.33 | - | 20 | - | 171.55 | 72.47 | 137.39 |
| Mesh Length (cm) | 9 | - | 6 | - | 7.66 | 7.8 | 7.71 |
| Mesh Width (cm) | 12.33 | - | 11 | - | 11.56 | 16.8 | 13.40 |
| Mesh Area (cm²) | 119 | - | 66 | - | 91.85 | 127.8 | 105.21 |
The correlation between the preoperative data; duration of herniation, hernia dimensions and the size of external hernia ring (by clinical examination and by ultrasonographic examination) with intraoperative data; mesh dimension and operative time, with postoperative data; the total hospital stays, with the exitance and distribution of comorbidities in each group, as shown in Table 13.
Table 13: Impact of Comorbidities on Key Metrics.
| Metric | Group (Comorbidities Absent) | Group A (Comorbidities Present) | Group B (Comorbidities Absent) | Group B (Comorbidities Present) | Grand Total (Comorbidities Absent) | Grand Total (Comorbidities Present) |
| Sum
of Total hospitalization duration (beds/day) |
5.11 | 4.78 | 5.2 | 5 | 5.13 | 4.86 |
| Duration of Herniation (Months) | 42.84 | 24.63 | 27.60 | 15.60 | 37.59 | 21.52 |
| Hernia Length (cm) | 8.63 | 7.84 | 6.10 | 6.40 | 7.76 | 7.34 |
| Hernia Width (cm) | 5.29 | 4.95 | 4.80 | 4.70 | 5.12 | 4.86 |
| Hernia Height (cm) | 3.69 | 3.14 | 3.00 | 2.50 | 3.56 | 3.00 |
| Hernia Volume (cm³) | 185.26 | 91.63 | 66.50 | 41.30 | 144.31 | 74.28 |
| External Inguinal Ring Size (cm) | 53.68 | 50.53 | 46.50 | 50.50 | 51.21 | 50.52 |
| Operative Time (Minutes) | 2.68 | 2.42 | 2.65 | 2.25 | 2.67 | 2.36 |
| Length of Hernia Sac (cm) | 8.05 | 8.11 | 6.30 | 7.30 | 7.45 | 7.83 |
| Width of Hernia Sac (cm) | 4.39 | 4.97 | 3.95 | 3.85 | 4.24 | 4.59 |
| Height of Hernia Sac (cm) | 2.97 | 3.56 | 2.80 | 2.63 | 2.93 | 3.25 |
| Volume of Hernia Sac (cm³) | 170.11 | 173.00 | 52.75 | 92.20 | 129.64 | 145.14 |
| Mesh Length (cm) | 7.89 | 7.42 | 6.90 | 8.70 | 7.55 | 7.86 |
| Mesh Width (cm) | 11.58 | 11.63 | 11.40 | 22.20 | 11.52 | 15.28 |
| Mesh Area (cm²) | 95.53 | 91.11 | 81.90 | 173.70 | 90.83 | 119.59 |
Duration of Herniation: Longer durations are observed in cases without comorbidities, particularly in Group A.
Hernia Dimensions: Hernia lengths and volumes are generally larger in cases without comorbidities across both groups.
Operative Time: Operative time is consistent across all categories, with no significant variation between comorbidities present or absent.
Mesh Characteristics: Group B uses larger mesh areas in comorbidity cases, indicating a possible adaptation to patient conditions.
This structured table allows for a clear comparison of the impact of comorbidities on surgical and hernia metrics. Let me know if you need further analyses or visualizations.
In group A we found 3/38 (3.9%) patients with post-operative pain which was relived upon administration of NSAIDs. No other complications among other group members.
Whereas in group B we found 1/20 (5%) patient with post-operative pain which was relived by administration of NSAIDs. No other complications among other group members.
In group (A); No complications. No recurrences.
In group (B); No complications. No recurrences.
1. Comparison of Duration of Herniation (Months) Between Both Groups, as shown in table 14.
Table 14: Comparison of Duration of Herniation (Months) Between Both Groups.
| Metric | Group A | Group B |
| Mean | 35 | 22.75 |
| Variance | 1527.622 | 790.0921 |
| Observations | 38 | 20 |
| Pooled Variance | 1277.388 | - |
| t Stat | 1.240702 | - |
| P(T<=t) two-tail | 0.109944 | - |
| t Critical two-tail | 1.672522 | - |
Interpretation: The p-value (0.109944) is greater than 0.05, meaning there is no statistically significant difference in the duration of herniation between the two groups
2. Comparison of Total Hospitalization Duration (Beds/Day) Between Both Groups, as shown in Table 15.
Table 15: Comparison of Total Hospitalization Duration (Beds/Day) Between Both Groups.
| Metric | Group A | Group B |
| Mean | 4.95 | 5.10 |
| Variance | 1.29 | 1.15 |
| Observations | 38 | 20 |
| Pooled Variance | 1.24 | - |
| t Stat | -0.495 | - |
| P(T<=t) two-tail | 0.622 | - |
| t Critical two-tail | 2.003 | - |
Interpretation: The p-value (0.622) is greater than 0.05, indicating no statistically significant difference in the total hospitalization duration between the two groups.
3. Comparison of Operative Time (Minutes) Between both groups, as shown in Table 16.
Table 16: Comparison of Operative Time (Minutes) Between Group A and Group B.
| Metric | Group A | Group B |
| Mean | 51.97 | 48.50 |
| Variance | 302.08 | 108.16 |
| Observations | 38 | 20 |
| Pooled Variance | 236.28 | - |
| t Stat | 0.82 | - |
| P(T<=t) two-tail | 0.21 | - |
| t Critical two-tail | 1.67 | - |
Interpretation: The p-value (0.21) is greater than 0.05, showing no statistically significant difference in operative time between the two groups.
In our study, we conducted a combined prospective-retrospective comparative analysis, using an artificial intelligence statistical science program applying machine learning algorithms, for detecting the differences between using polypropylene and polyester mesh implants during Lichtenstein repair for 2 groups of patients with primary inguinal hernias. We found the following results:
No significant differences regarding the duration of herniation upon the outcomes of the study regarding operative time, duration of hospital stay or even more the complications during postoperative hospitalization and also during short-term follow-up. However, longer durations are observed in cases without comorbidities, particularly in Group A. The p-value (0.109944) is greater than 0.05, meaning there is no statistically significant difference in the duration of herniation between the two groups.
No significant differences regarding the operative time among both groups.
The p-value (0.21) is greater than 0.05, showing no statistically significant difference in operative time between the two groups.
No significant differences regarding the total hospitalization duration among both groups. The p-value (0.622) is greater than 0.05, indicating no statistically significant difference in the total hospitalization duration between the two groups.
Hernia Dimensions: Hernia dimensions and volumes are generally larger in cases without comorbidities across both groups. However, Group A exhibited larger hernia sizes, while Group B utilized larger mesh areas.
The presence and distribution of comorbidities especially arterial hypertension had no significant effect upon the progress of the operations, suggesting it to be a reason of hernia rather than effect [12].
The analysis of data using artificial intelligence statistical science programming language (Python) applying machine learning, we found no significant differences regarding operative-time, total duration of hospitalization stays, rates of complications during the post-operative and short-term follow-up periods upon using polypropylene and polyester mesh implants during Lichtenstein, even in the presence or absence of concomitant comorbidities.
Both polypropylene and polyester meshes demonstrate equivalent performance in terms of operative efficiency, safety, and early postoperative outcomes. Mesh selection can therefore be based on individual patient characteristics, surgeon experience, or economic considerations, rather than expected clinical superiority.
Authors have no conflict of interest to declare.
This publication was prepared without any external source of funding.
Mekhaeel Mekhaeel, Protasov Andrey, Salem Sameh, Al-Tekreeti Khalid - conceptualization, writing original draft, review and editing, project administration; Mekhaeel Mekhaeel, Salem Sameh, Al-Tekreeti Khalid, Mohareb Abanoub– visualization, Mekhaeel Mekhaeel, Protasov Andrey, Reza Kashyzadeh Kazem – supervision.

|
||